Period doubling and chaos in hydrodynamic type-II Cepheid models
| project | Iuventus+, IP2012 036572 |
| funding | Polish Ministry of Science and Higher Education, MNiSW |
| PI | Radosław Smolec |
| dates | 06.2013 - 11.2015, finished |
Jump to project highlights, refereed publications, conference contributions, and presentations.
Project Highlights
- Period doubling and other phenomena in the pulsation of type-II Cepheid models in the HR diagram
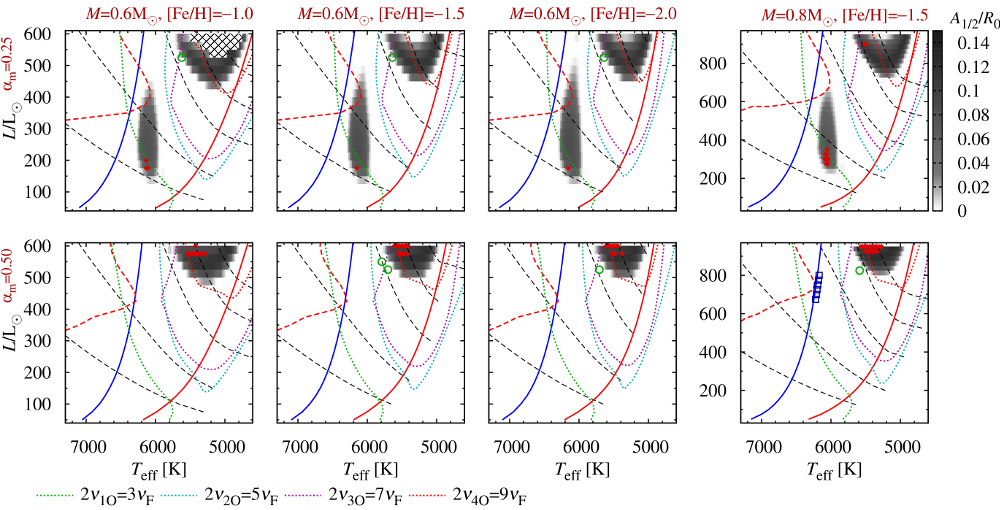
Fig. 1. Possible dynamical scenarios in the HR diagram for type-II Cepheid models of different mass, metallicity and convective parameters. Grey-shaded areas correspond to domains of period-doubling. Filled diamonds mark models in which period-4 pulsation was detected. In models marked with open circles modulation was found. Open squares in the bottom right panel are double-mode F+4O models. Black dashed lines plotted in each panel are lines of constant fundamental mode period, from top to bottom: 2, 4, 8, 12 and 16 days. Loci of various half-integer resonances are marked with coloured dotted lines as indicated in the bottom part of the figure.
We have conducted a large survey of hydrodynamic type-II Cepheid models with two different masses (0.6MS and 0.8MS) and three metallicities, [Fe/H]=-1.0, -1.5 and -2.0. We also used two sets of convective parameters. Our models display a wealth of dynamical behaviours, in particular:
- Period-doubling behaviour is detected in two well separated domains - grey-shaded areas in Fig. 1 above. The lower-luminosity period-doubling domain extends nearly vertically from BL Her to short-period W Vir domain. Pulsation periods are in the 2-6.5 d range. It is the same domain as computed by Buchler and Moskalik (1992, ADS) who predicted the existence of period doubled BL Her stars. Their prediction was later confirmed with the discovery of the first period-doubled BL Her star, OGLE-BLG-T2CEP-279 (Soszynski et al. 2011, ADS, Smolec et al. 2012, ADS). The second period-doubling domain extends at higher luminosities and longer periods, in the W Vir domain (P>9.5 days).
- Period-4 pulsation is observed in several models located within period-doubled domains (marked with filled diamonds in Fig. 1). This form of pulsation was not yet observed in type-II Cepheids.
- Small-amplitude modulation of pulsation is detected in several models marked in Fig. 1 with open circles. The domains with modulation of pulsation are very narrow (~10K wide). The models are of W Vir type, typical pulsation periods are 9-10 days, while modulation periods are several times longer.
- Double-mode pulsation in the radial fundamental and radial fourth overtone modes is detected in models marked with open squares (see the highlight below).
No large-amplitude chaotic behaviour was detected in our models. We note that our survey is limited in luminosity due to dynamical instability that prevents computation of the most luminous models. Read more in MNRAS paper (PDF, arXiv:1512.01550).
- Double-mode pulsation in the fundamental mode and fourth overtone (surface mode)
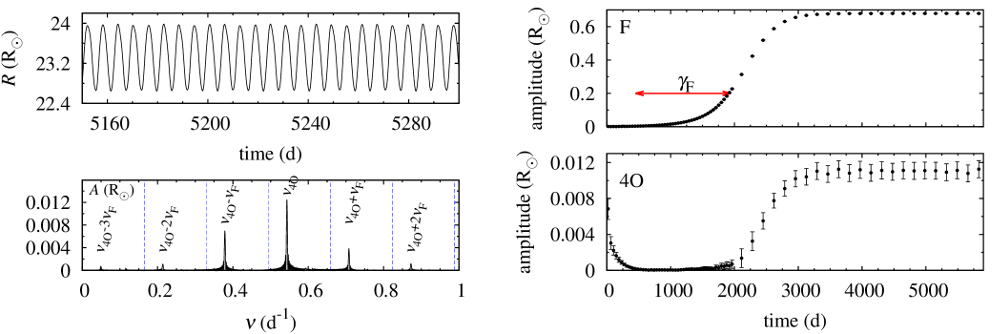
Fig. 2. Top left panel: radius variation for the F+4O double-mode model; Bottom left panel: frequency spectrum after prewhitening with the fundamental mode and its harmonics (dashed blue lines); Right panels: amplitude of the fundamental mode (top) and of the fourth overtone (bottom) during the initial phase of model integration.
In our survey of type-II Cepheid models we have detected a very interesting form of pulsation: double-mode pulsation in the fundamental mode and in the fourth overtone (open squares in Fig. 1). Fourth overtone is a special mode: it is trapped in the outer model layers, between the surface and the partial ionization regions (such modes are sometimes called strange, see e.g. Buchler et al. 1997, ADS). Although its linear growth rate is negative, the mode is only weakly damped as compared to the neighbouring overtones. Amplitude of the fourth overtone is very small; the beating pattern is barely visible in the radius variation curve (top left panel in Fig. 2), but the presence of the fourth overtone is clearly revealed in the frequency spectrum (bottom left panel in Fig. 2). This form of pulsation was detected only in the more massive models adjacent to the blue edge of the instability strip (Fig. 1). Fundamental mode periods are 5.6-6.8 days, period ratios, P4O/PF, are around 0.3. The fourth overtone is weakly damped which is well visible in the bottom right panel of Fig. 2: its amplitude drops in the initial phase of model integration and starts to grow only when the amplitude of the fundamental mode (top right panel) becomes significant. Nevertheless, the origin of the beat pulsation is most likely non-resonant. Further analysis is needed and planned. Read more in MNRAS paper (PDF, arXiv:1512.01550).
- Deterministic chaos in BL Her type models
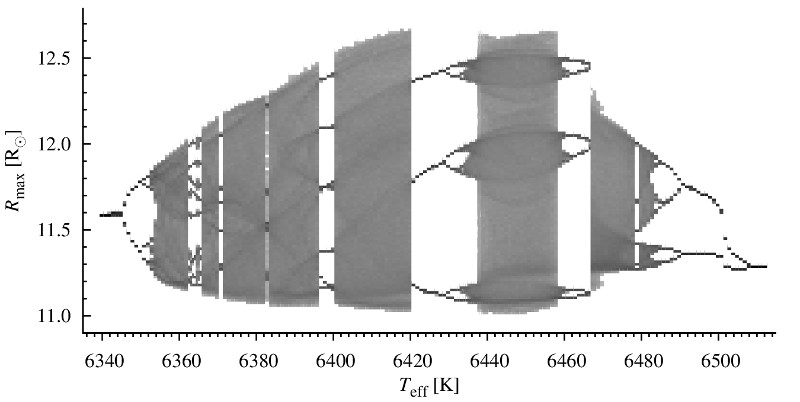
In a sequence of hydrodynamic BL Herculis type models (L=const, M=const, Teff varied) we have found a wealth of dynamic behaviours characteristic for deterministic chaos. Bifurcation diagram for the model sequence is presented above. It shows the possible values of maximum radii, Rmax, as a function of model's effective temperature. Many of the phenomena are detected for the first time in the context of pulsating stars. In our models we observe different routes to chaos, crisis bifurcation, stable periodic domains within chaotic bands, type-I and type-III intermittency.
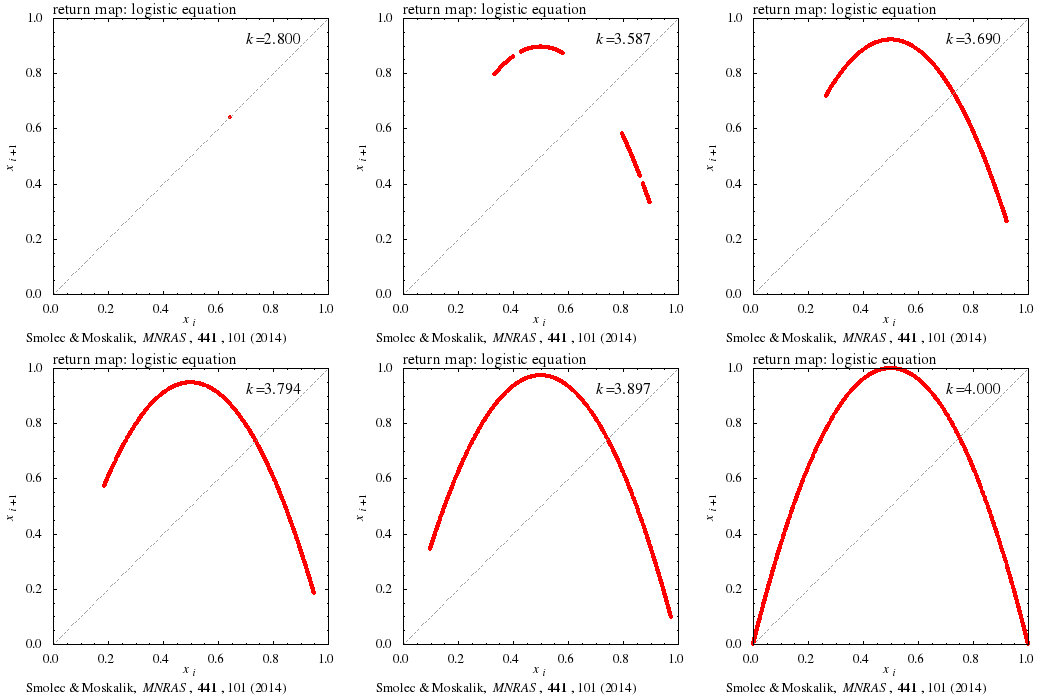
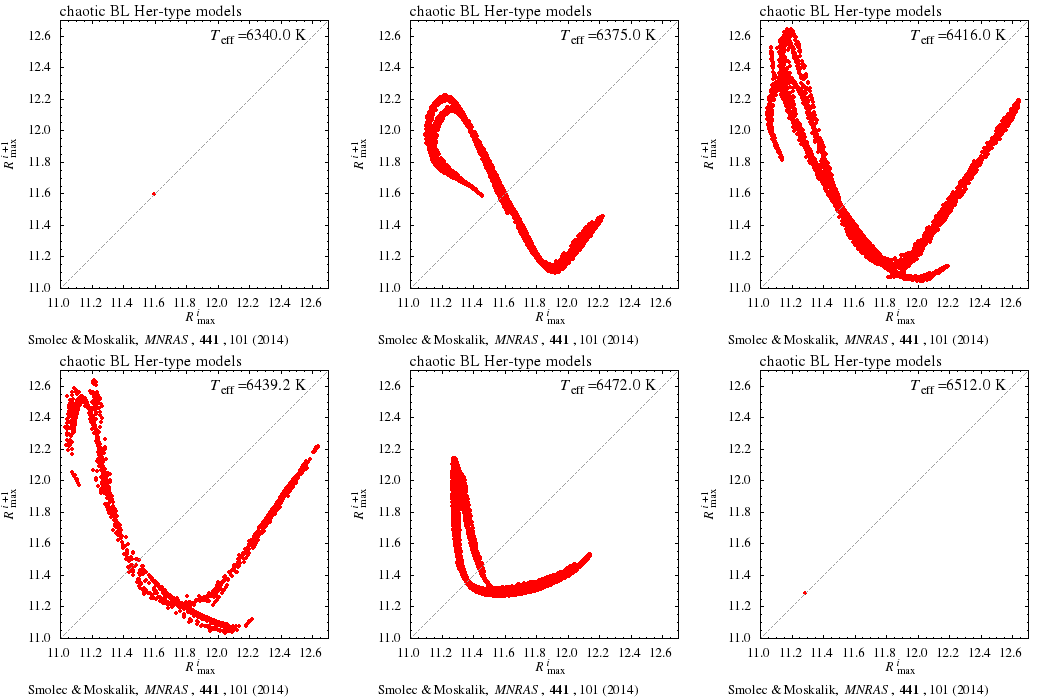
Hydrodynamic BL Her models are similar to other well known physical sytems showing the deterministic chaos. We find close anlogies between our models and even the simplest example of chaos: iteration of the logistic map, i.e. xi+1=kxi(1-xi). Animations below show: (left) the first return map for logistic equation (a plot of xi+1 vs. xi, as a function of k), and (right) first return map for maximum radii in the BL Her models models (a plot of Rmaxi+1 vs. Rmaxi as a function of Teff). Read more in MNRAS paper (PDF, arXiv:1403.4937).
Refereed Publications
- Smolec, R.; Survey of non-linear hydrodynamic models of type-II Cepheids; MNRAS, 456, 3475 (2016); PDF, arXiv:1512.01550
- Smolec, R., Moskalik, P.; Chaos in hydrodynamic BL Herculis models; MNRAS, 441, 101 (2014); PDF, arXiv:1403.4937
Conference Publications
- Smolec, R.; Nonlinear convective pulsation models of type II Cepheids, in Astronomy in Focus, XXIXB, E15 (2016); doi; Proc. of the IAU General Assembly XXIX, Focus Meeting 17: Advances in Stellar Physics from Asteroseismology, Honolulu, 3-14 August 2015; www
- Smolec, R.; Dynamical phenomena in the pulsation of type-II Cepheid models, in Mem. Soc. Astron. It., 87, 311-314 (2016); EWASS2015, Tenerife, 22-26 June 2015; www
- Smolec, R., Moskalik, P.; Order and chaos in hydrodynamic BL Her models, in Proc. of the Polish Astron. Soc., 1, 154-156 (2014); XXXVI Polish Astronomical Society Meeting, Warszawa, 11-15 September 2013; www
- Smolec, R., Moskalik, P.; Chaos in hydrodynamic models of pulsating BL Her-type stars; in 7th CHAOS Conference Proceedings, p. 471-479 (2014); The 7th Chaotic Modeling and Simulation International Conference, Lisbon, 7-10 June 2014; www
- Smolec, R., Moskalik, P.; Order and chaos in hydrodynamic BL Her models; IAUS 301, p. 489 (2014); arXiv:1309.5962; IAU Symposium No. 301: Precision Asteroseismology: Celebration of the Scientific Opus of Wojtek Dziembowski, Wroclaw, 19-23 August 2013; www
Presentations
- 2015, Poznań, XXXVII Meeting of the Polish Astronomical Society, 7-10 September; www
→ Nonlinear hydrodynamic models of type II Cepheids; poster - 2015, Honolulu, IAU XXIX General Assembly, 3-14 August; www
→ Nonlinear hydrodynamic models of type II Cepheids; poster - 2015, La Laguna, Tenerife, European Week of Astronomy and Space Science, EWASS 2015, 22-26 June; www
→ Nonlinear hydrodynamic models of type II Cepheids; poster - 2014, Lisbon, The 7th Chaotic Modeling and Simulation International Conference , 7-10 June; www
→ Chaos in hydrodynamic models of pulsating BL Her-type stars; contributed talk - 2013, Wroclaw, IAU Symposium No. 301: Precision Asteroseismology: Celebration of the Scientific Opus of Wojtek Dziembowski, 19-23 August; www
→ Order and chaos in hydrodynamic BL Her models; poster - 2013, Warszawa, XXXVI Meeting of the Polish Astronomical Society, 11-14 September; www
→ Order and chaos in hydrodynamic BL Her models; poster

