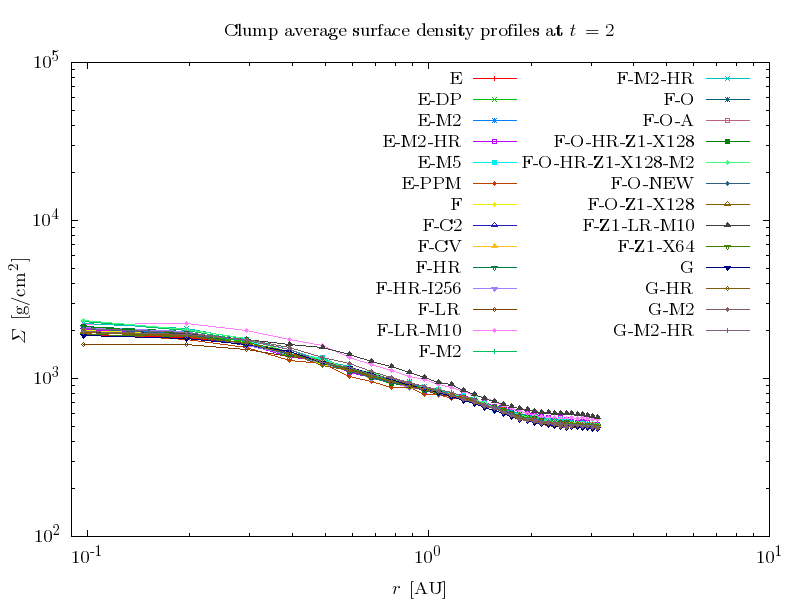
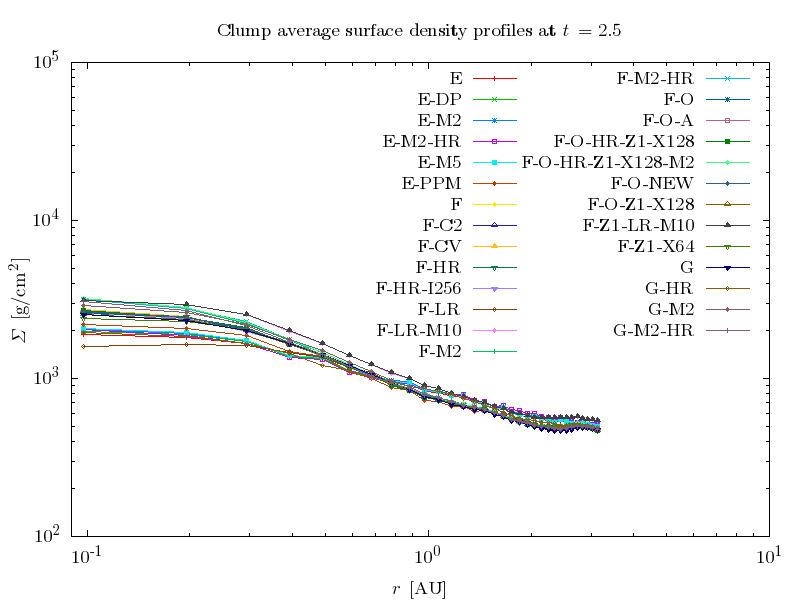
Comparison of density profiles around the most prominent clump
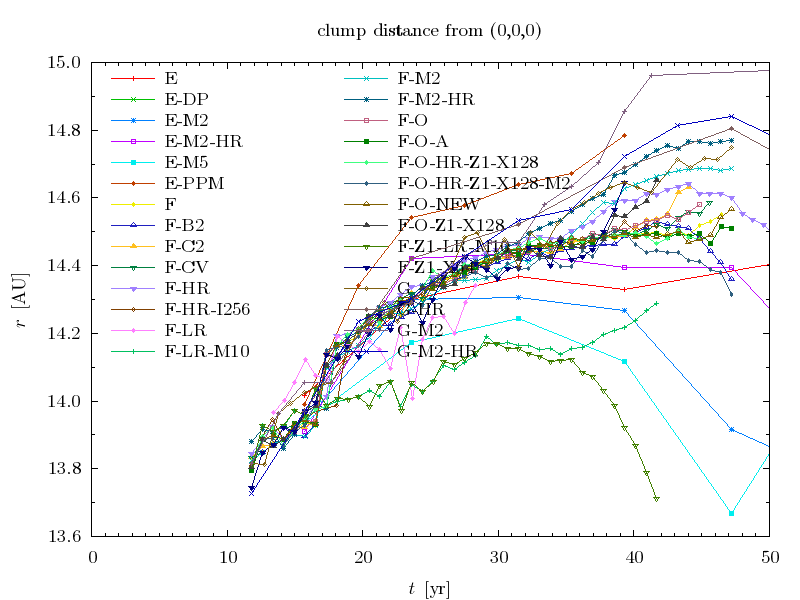
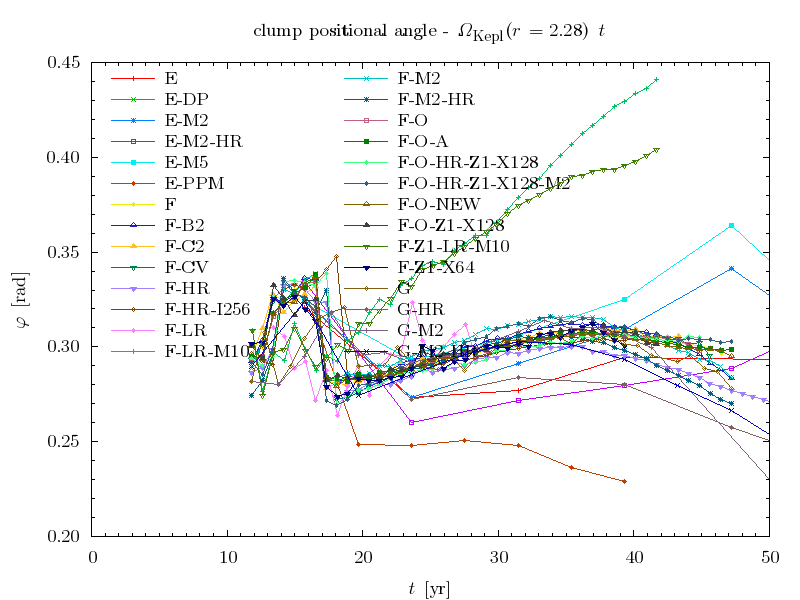
Position of the clump
The clump was identified as the maximum of density in small distance from region corotating with strongest observed clumps for t < 5.
The value of ΩKepl was approximately 0.92 (in code units).
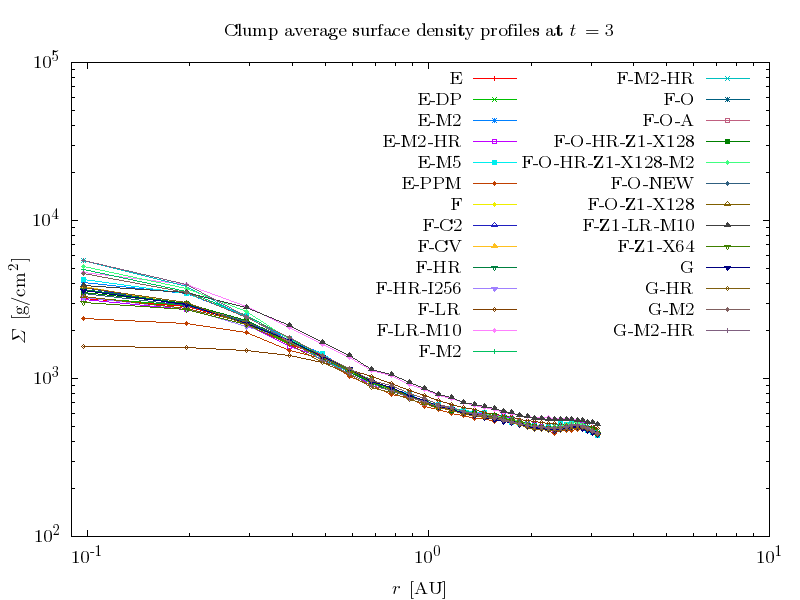
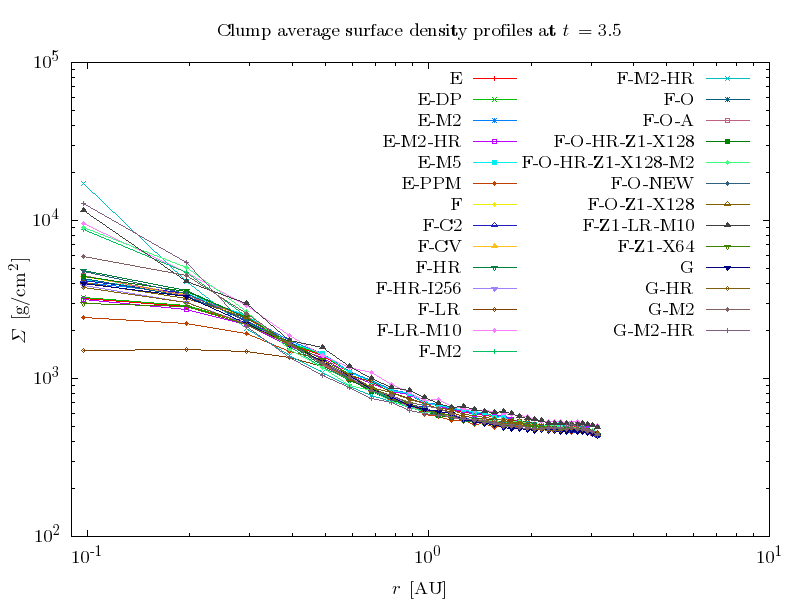
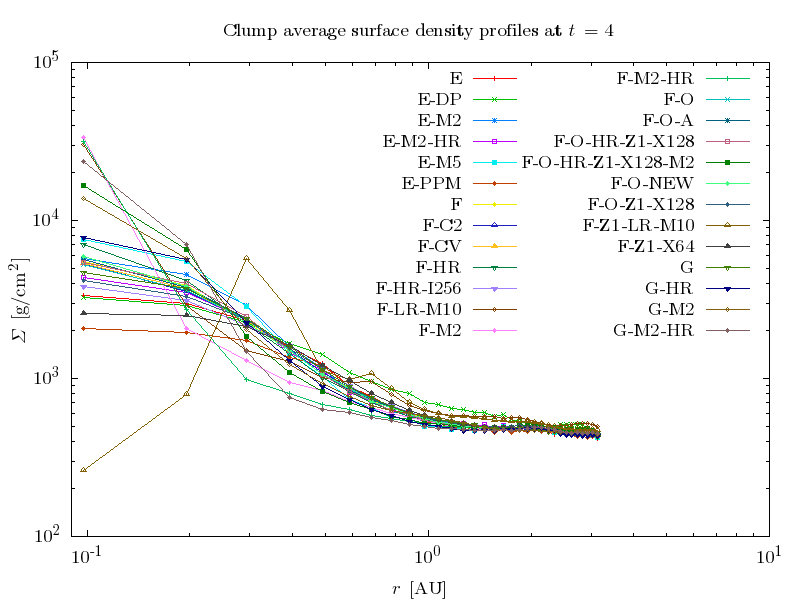
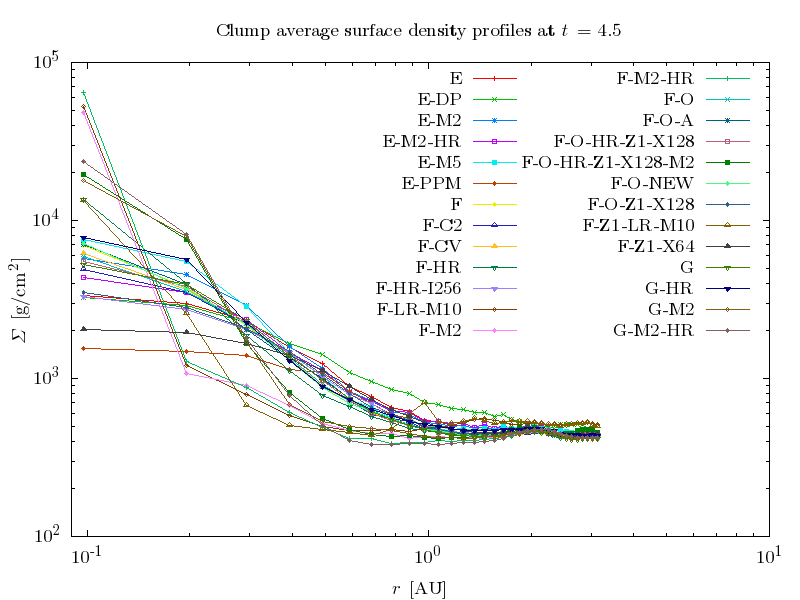
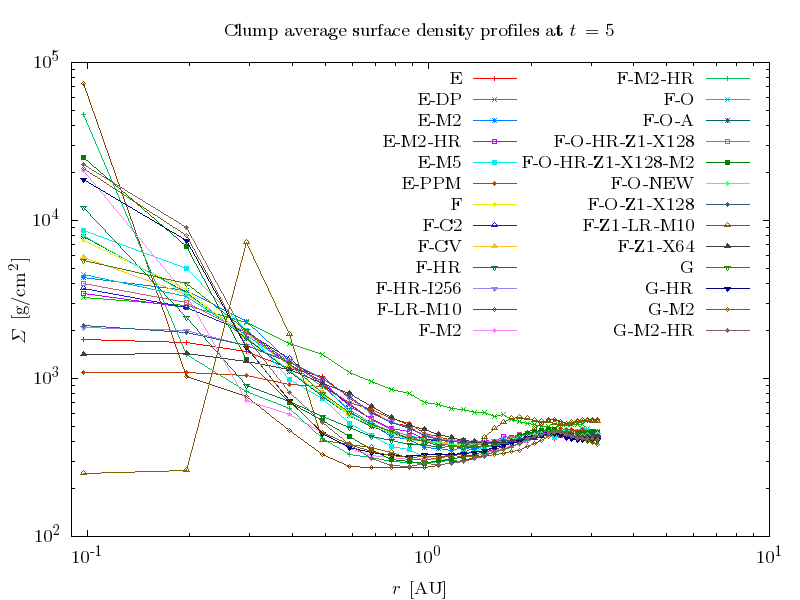
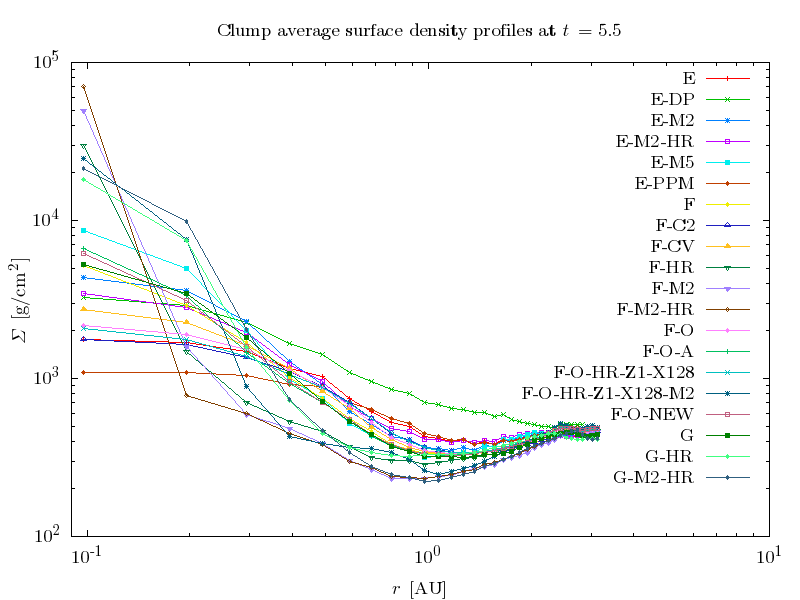
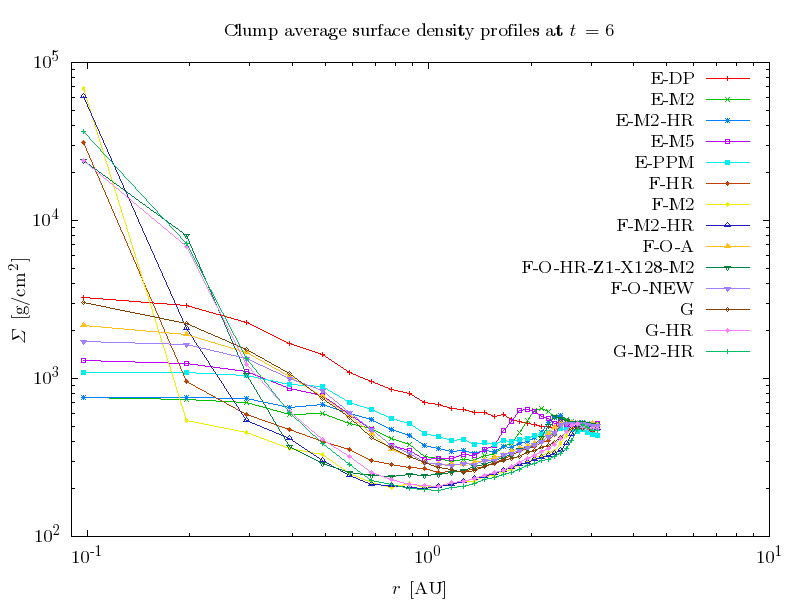
Surface density profiles
t = 2.0
t = 2.5
t = 3.0
t = 3.5
t = 4.0
t = 4.5
t = 5.0
t = 5.5
t = 6.0
Comments
Models "F" and "G" seems to have comparable resolution.
FLASH models at densities > 104 g/cm2 looks to resolve things better (and spent a lot more CPU-hors on AMR-enhanced stuff), which means that the singularity in density is still badly underresolved :-)