Distances to Nine Nearby Galaxies using Carbon Stars
The page contains plots depicting determinations of < J0 > for all studied samples of carbon stars, together with 'diagnostic' plots.
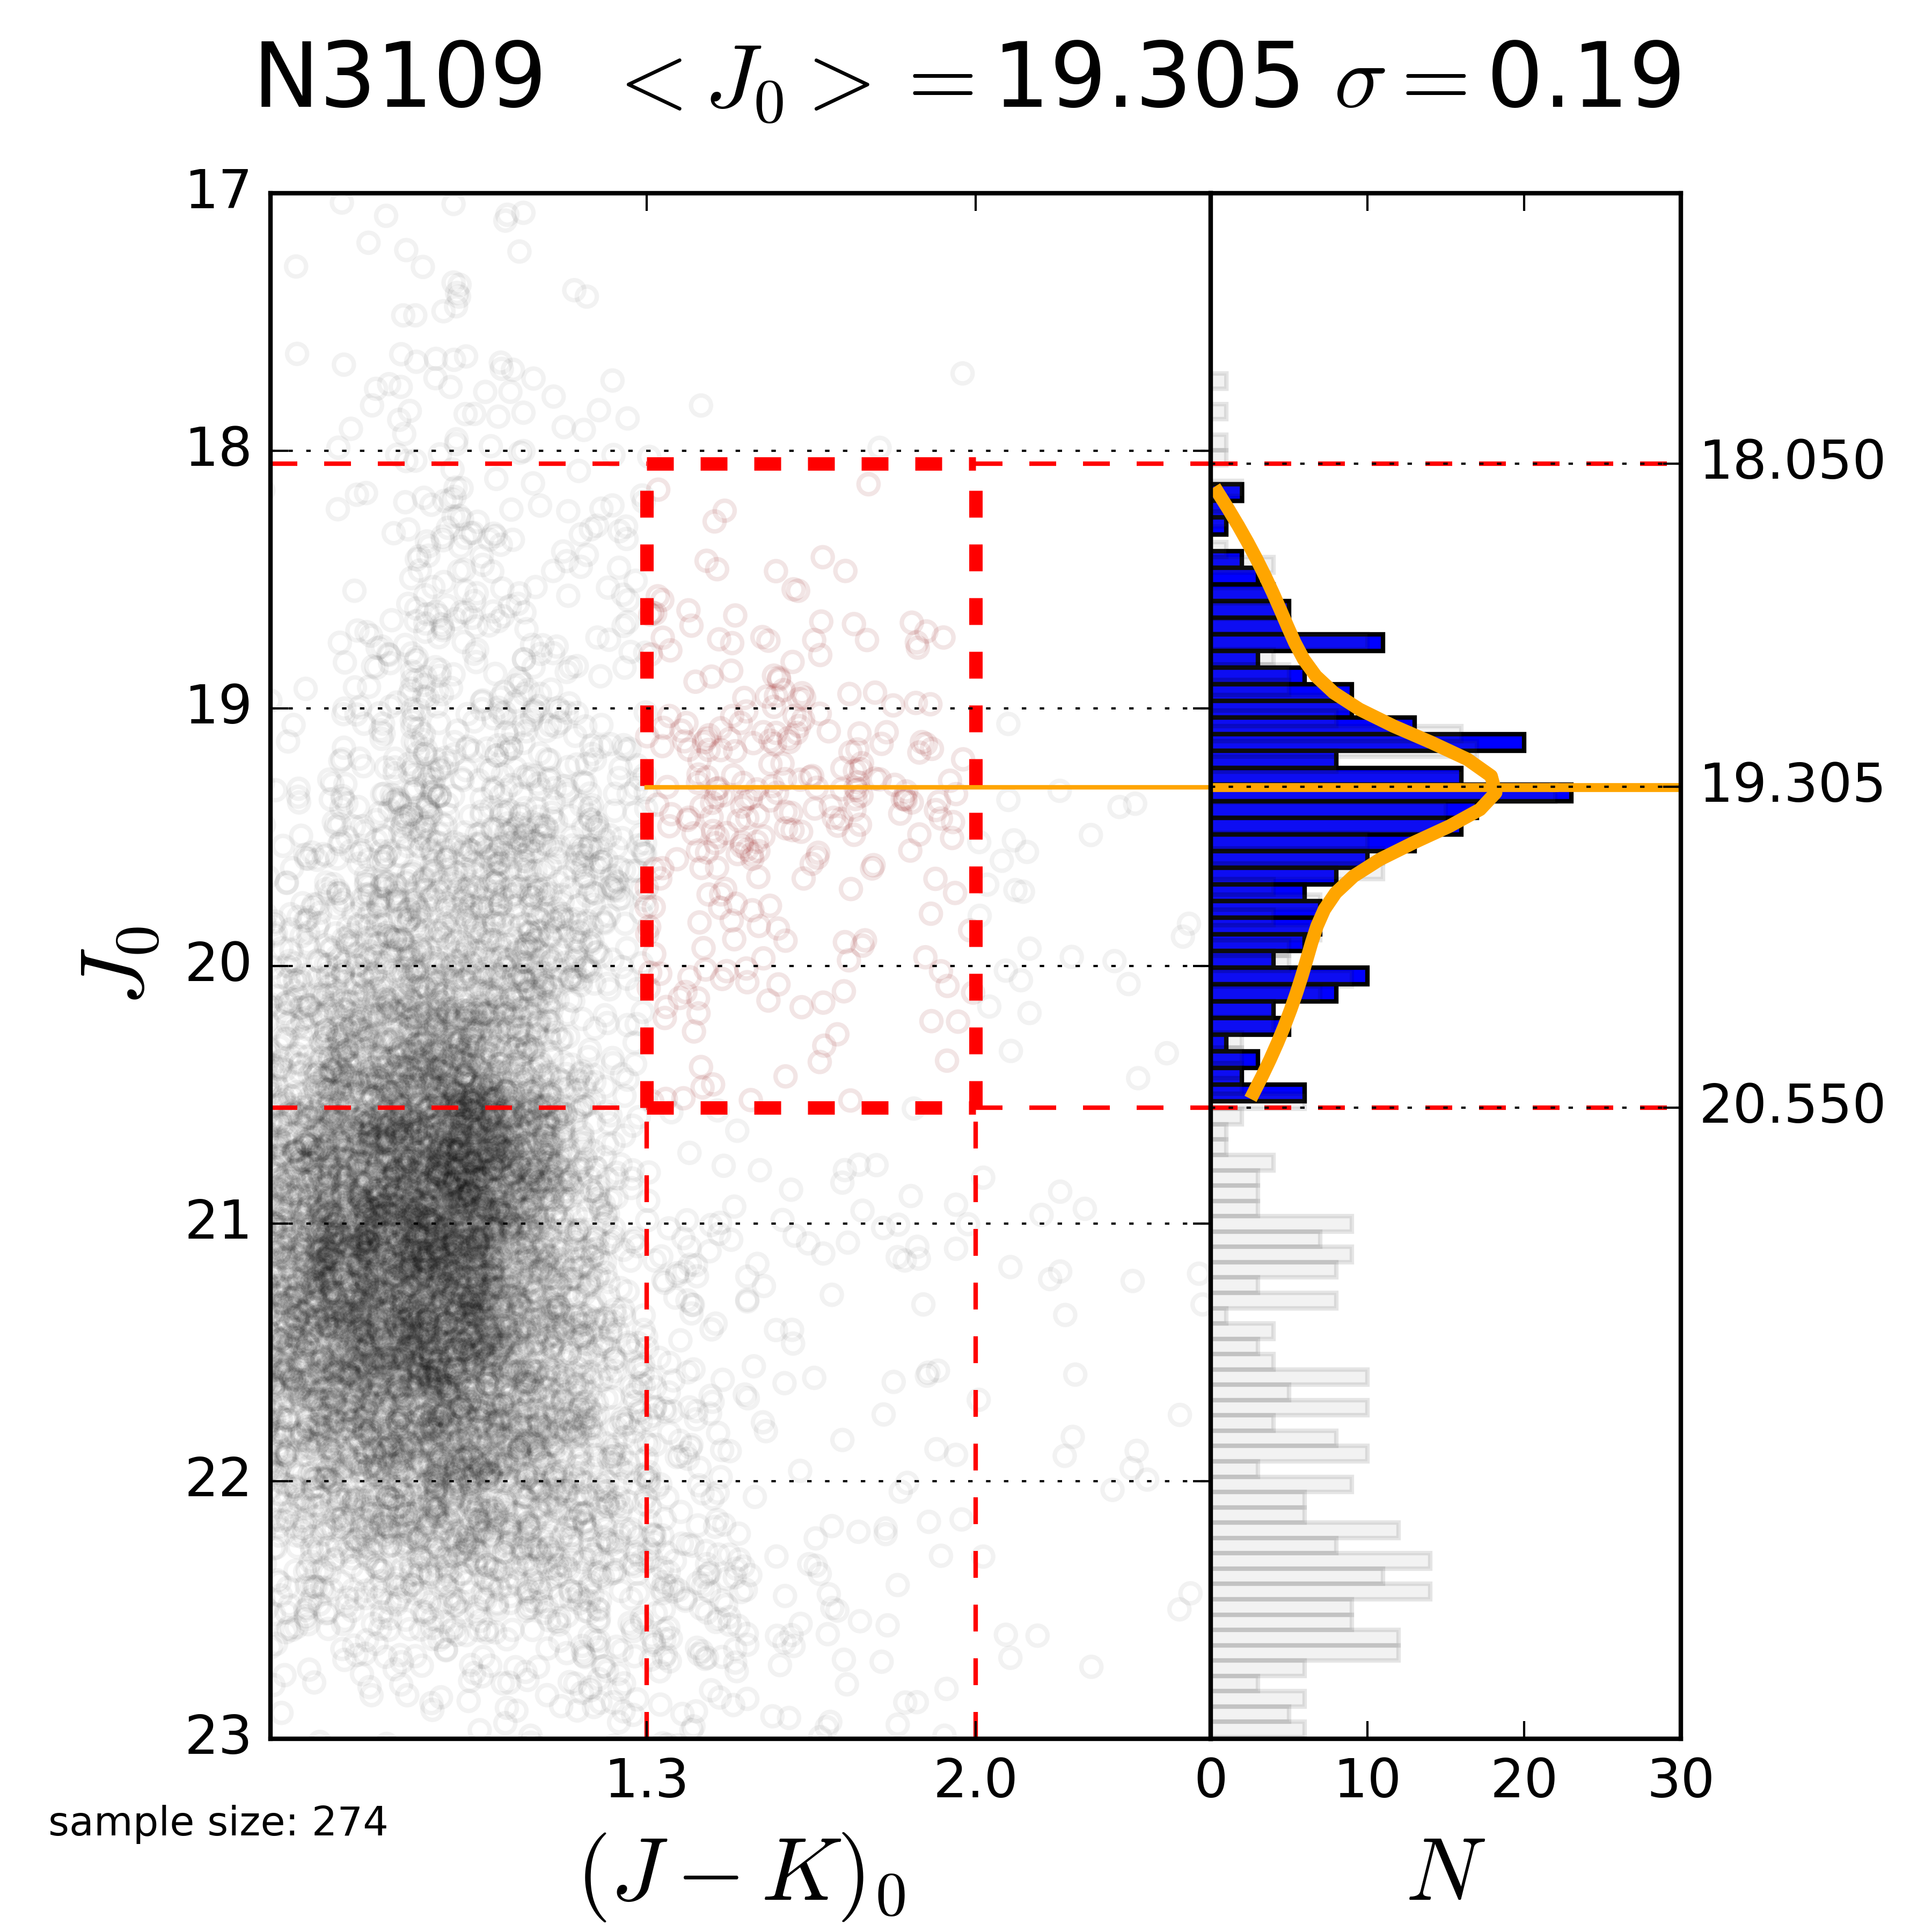
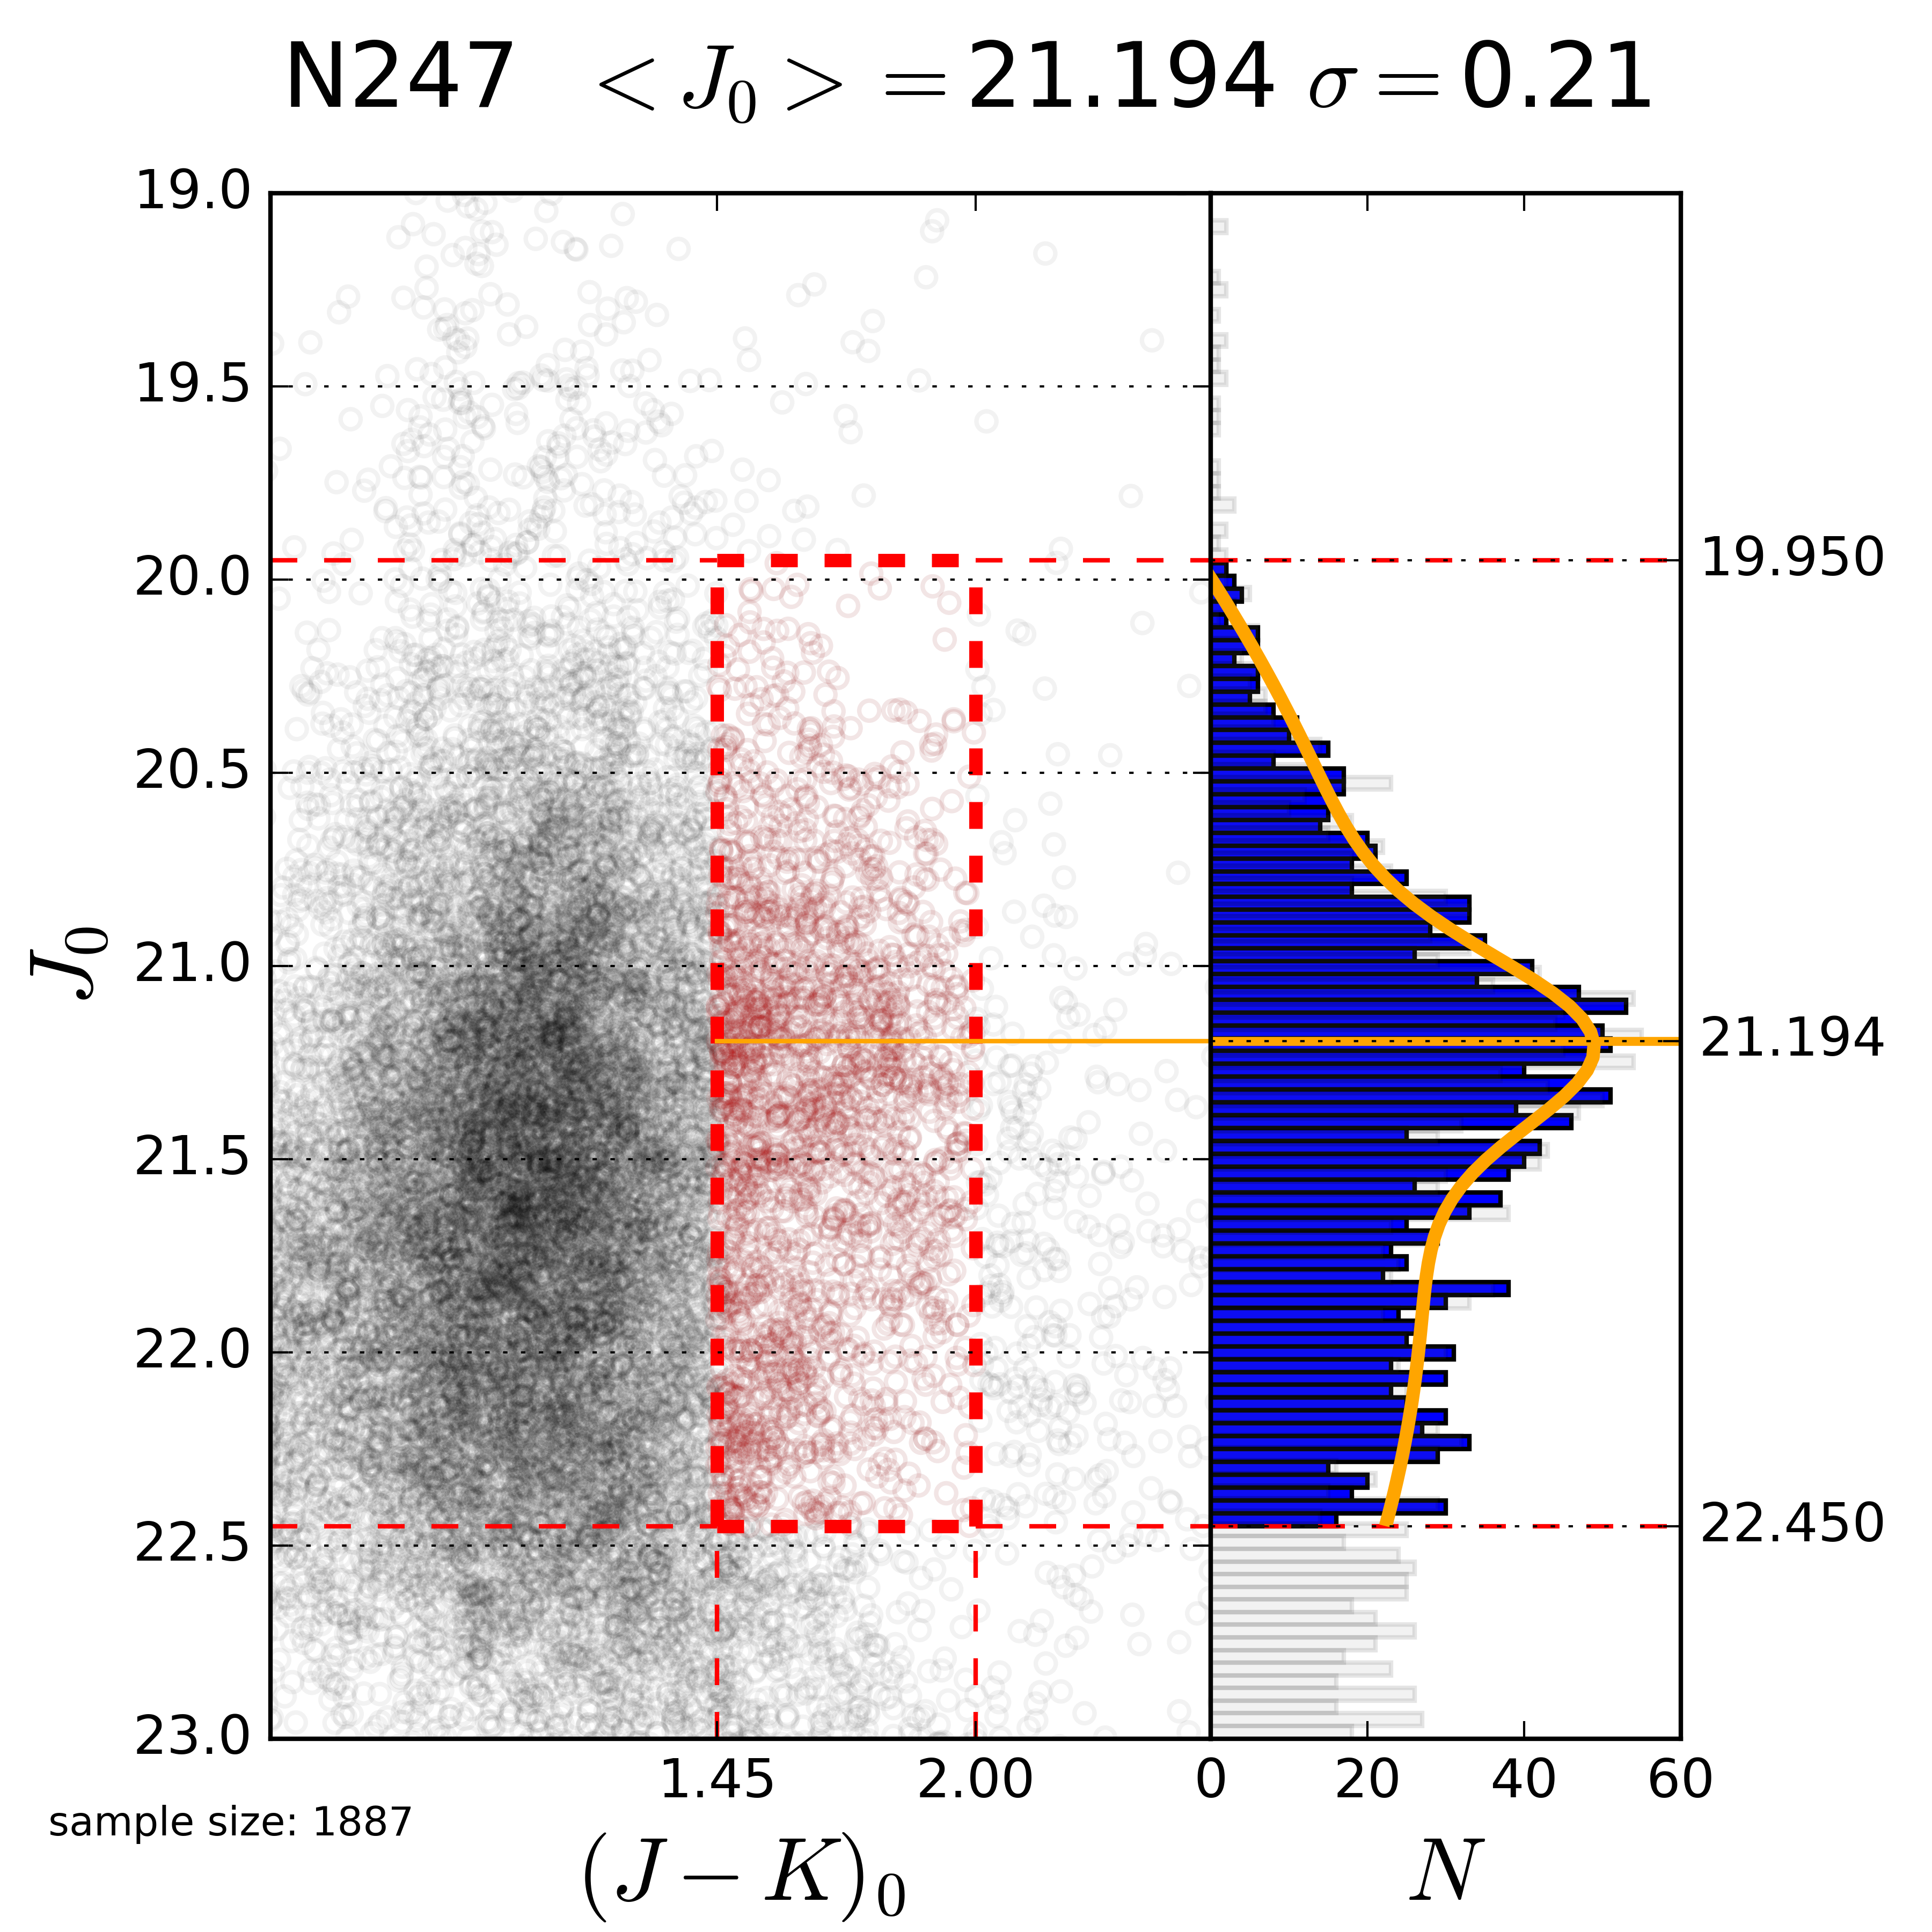
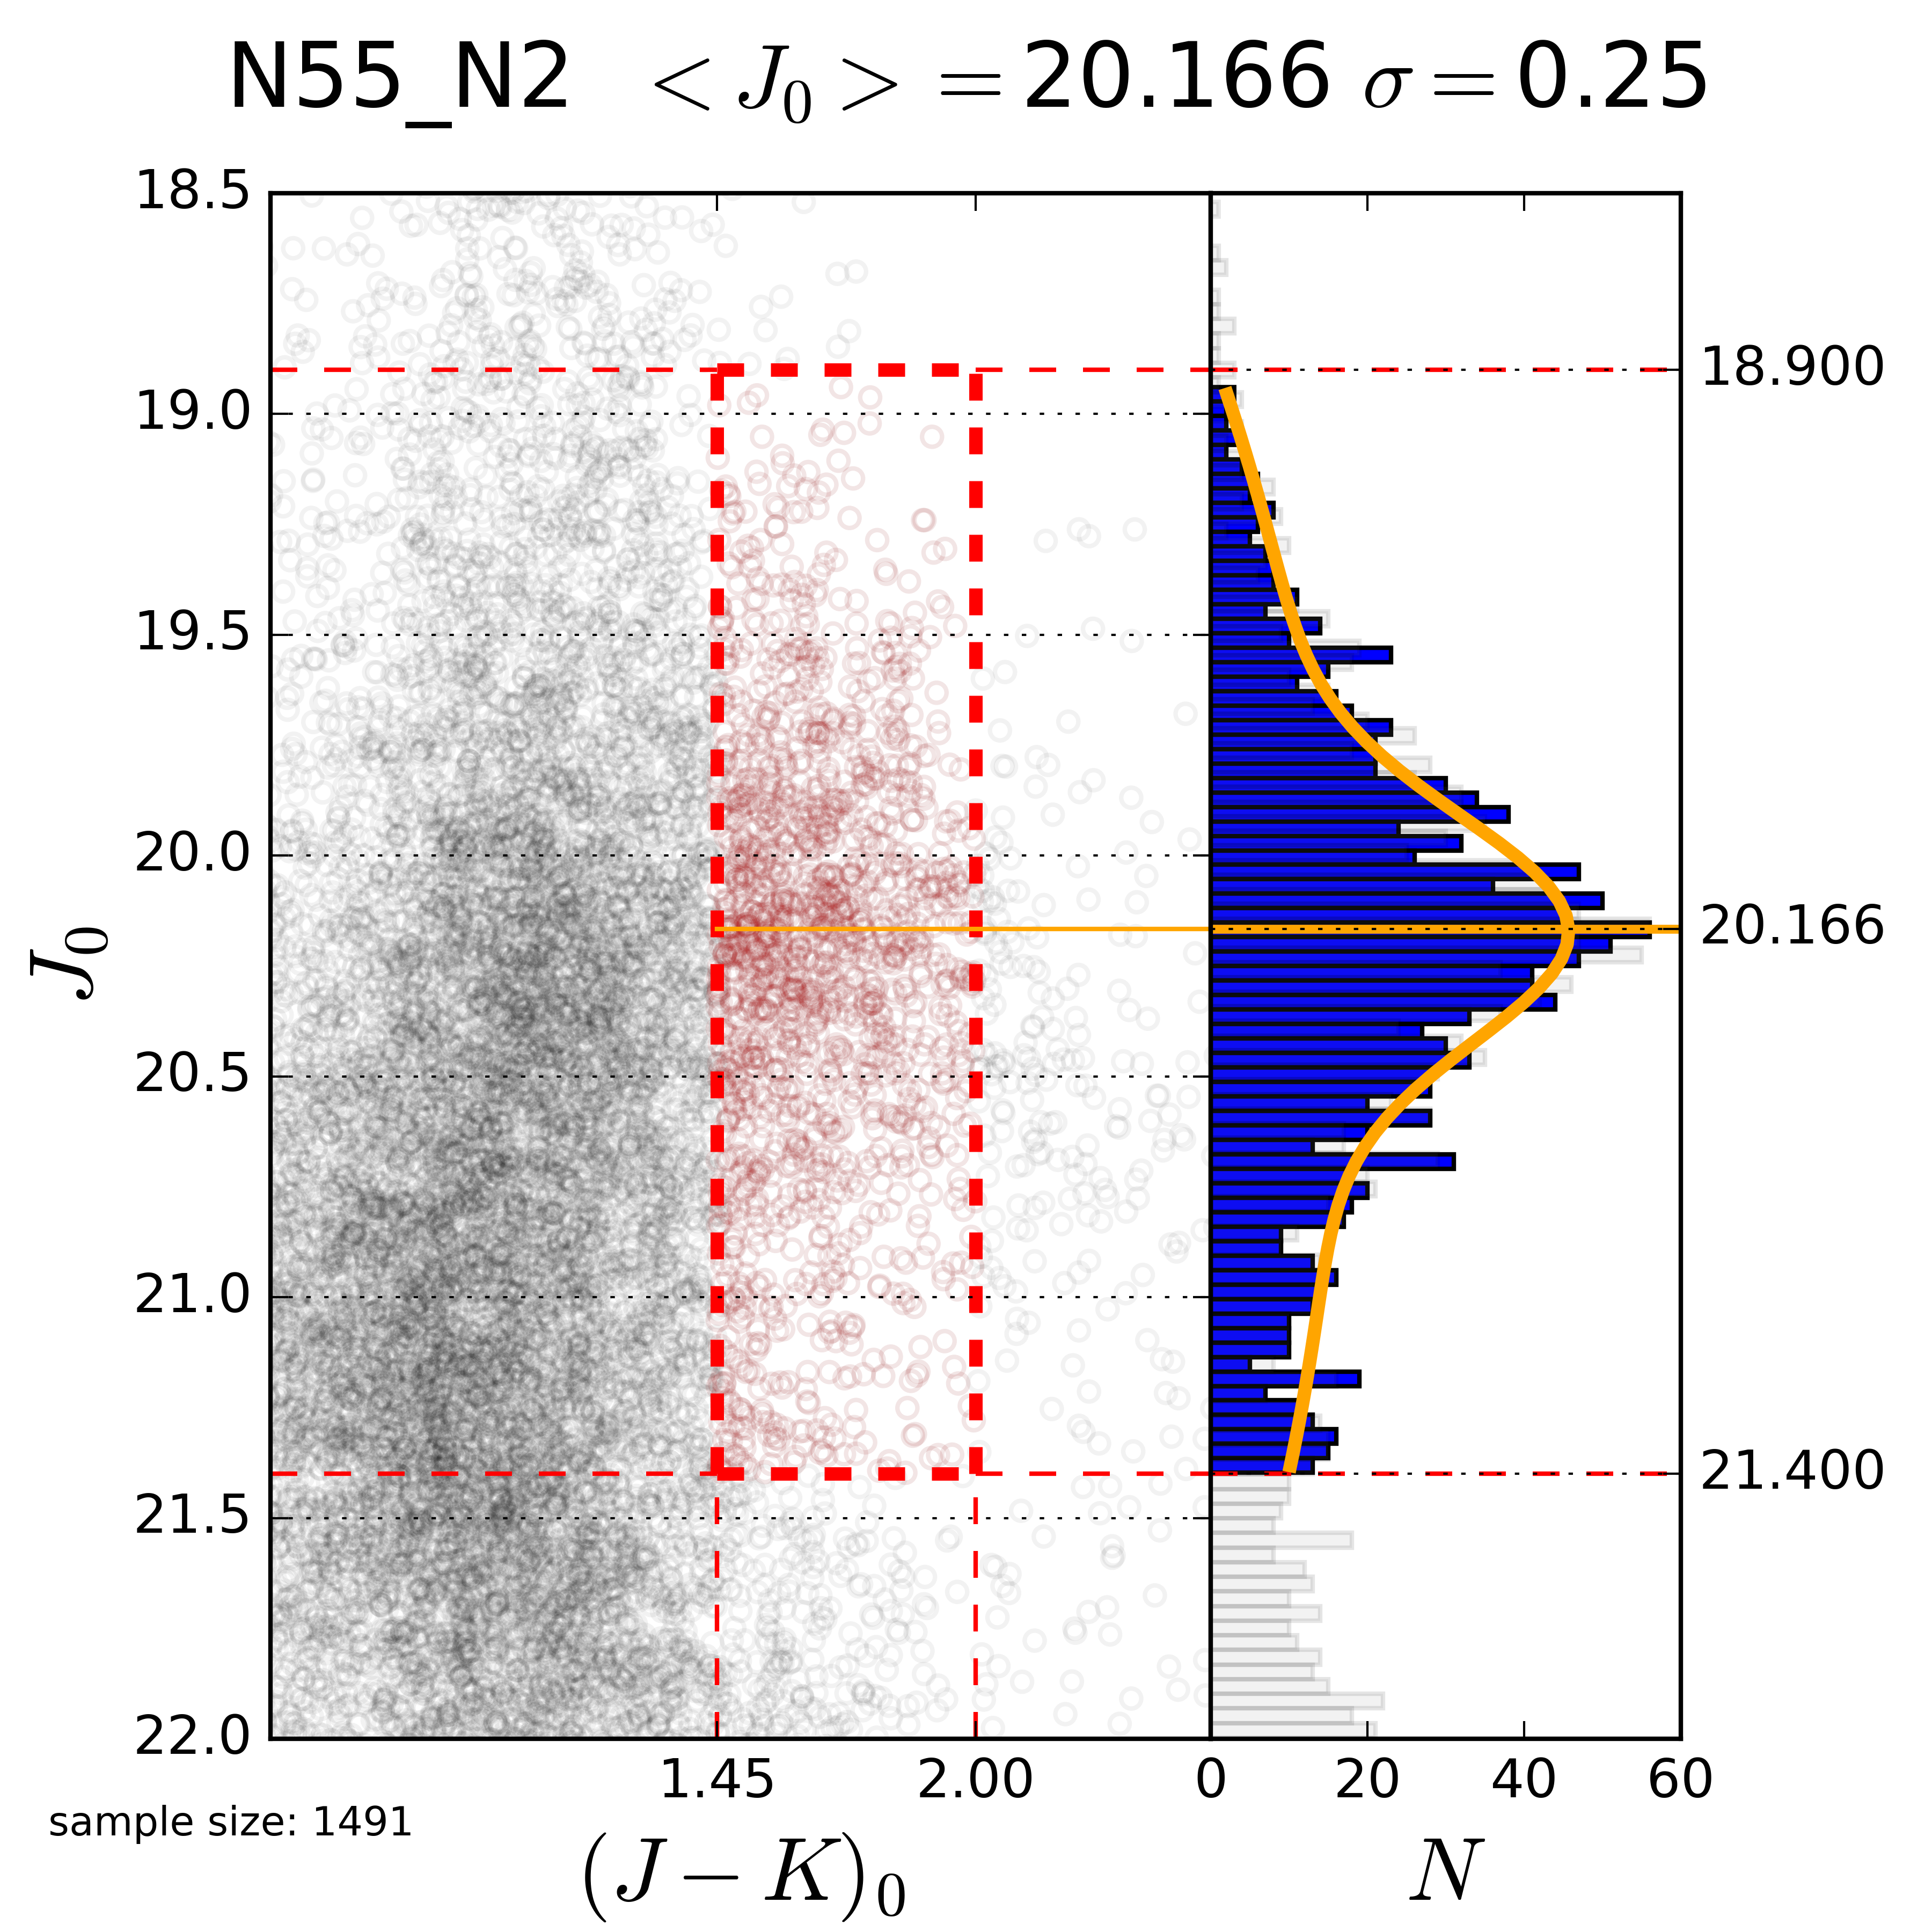
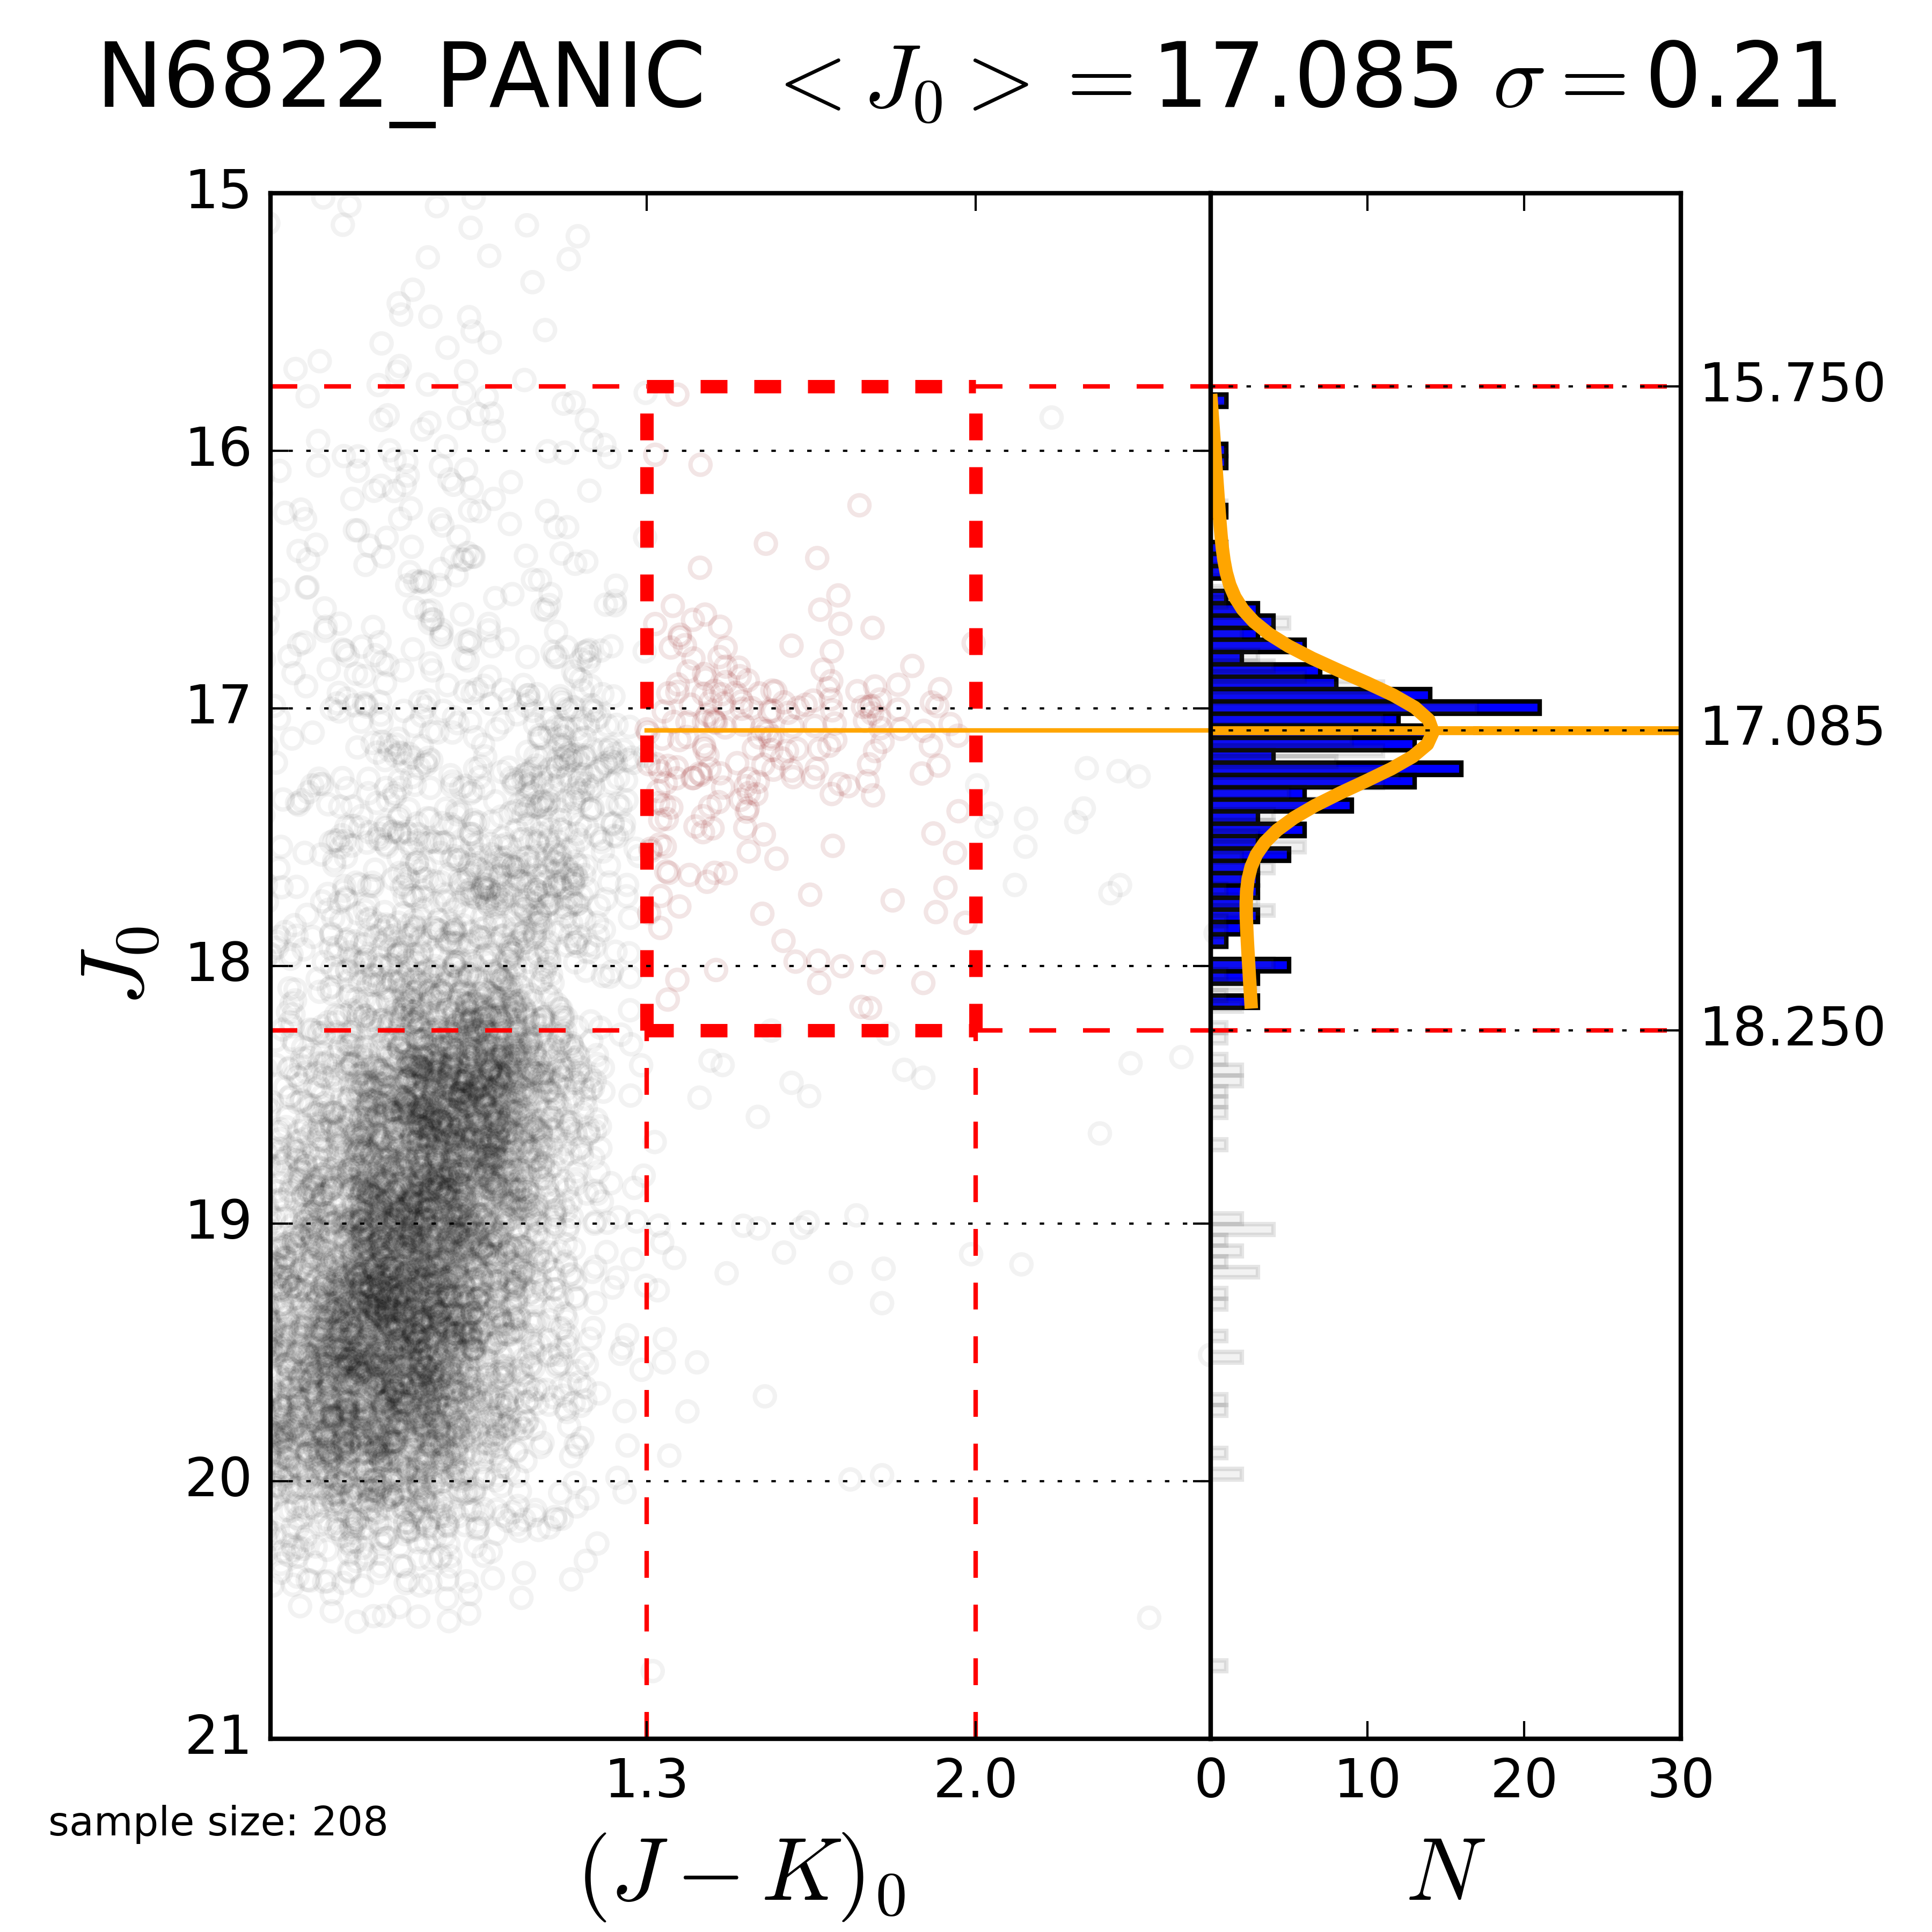
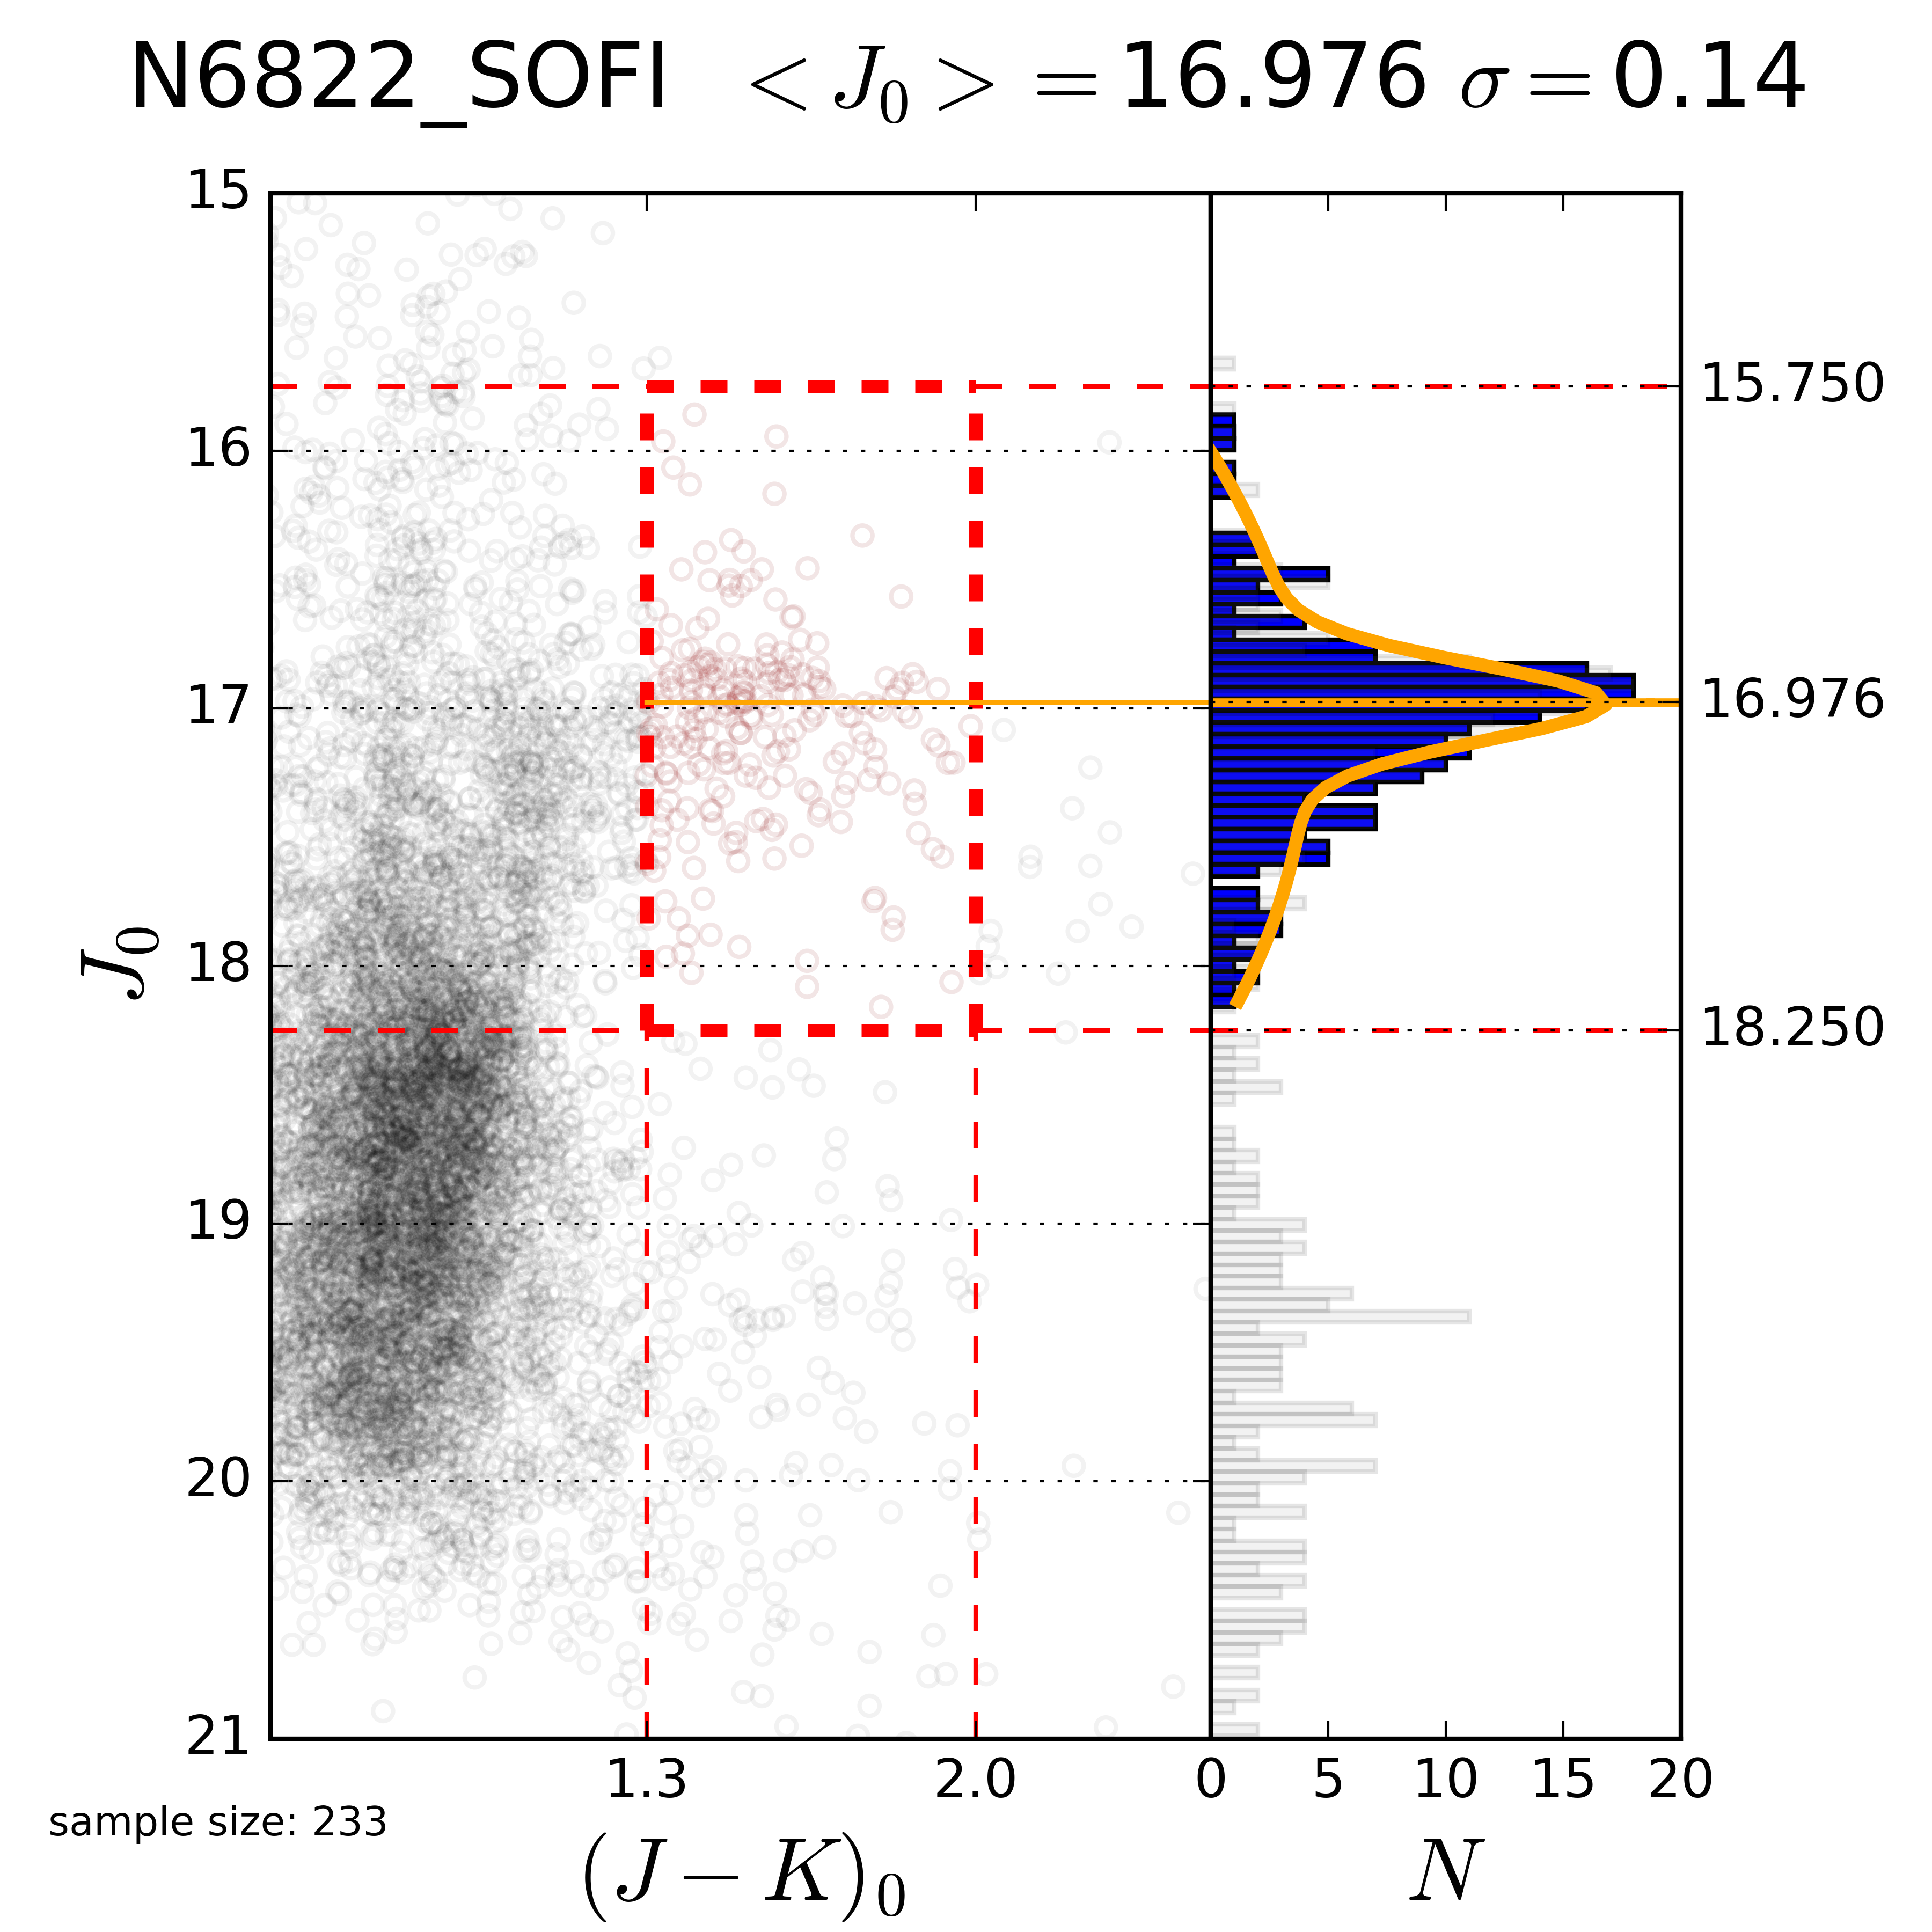
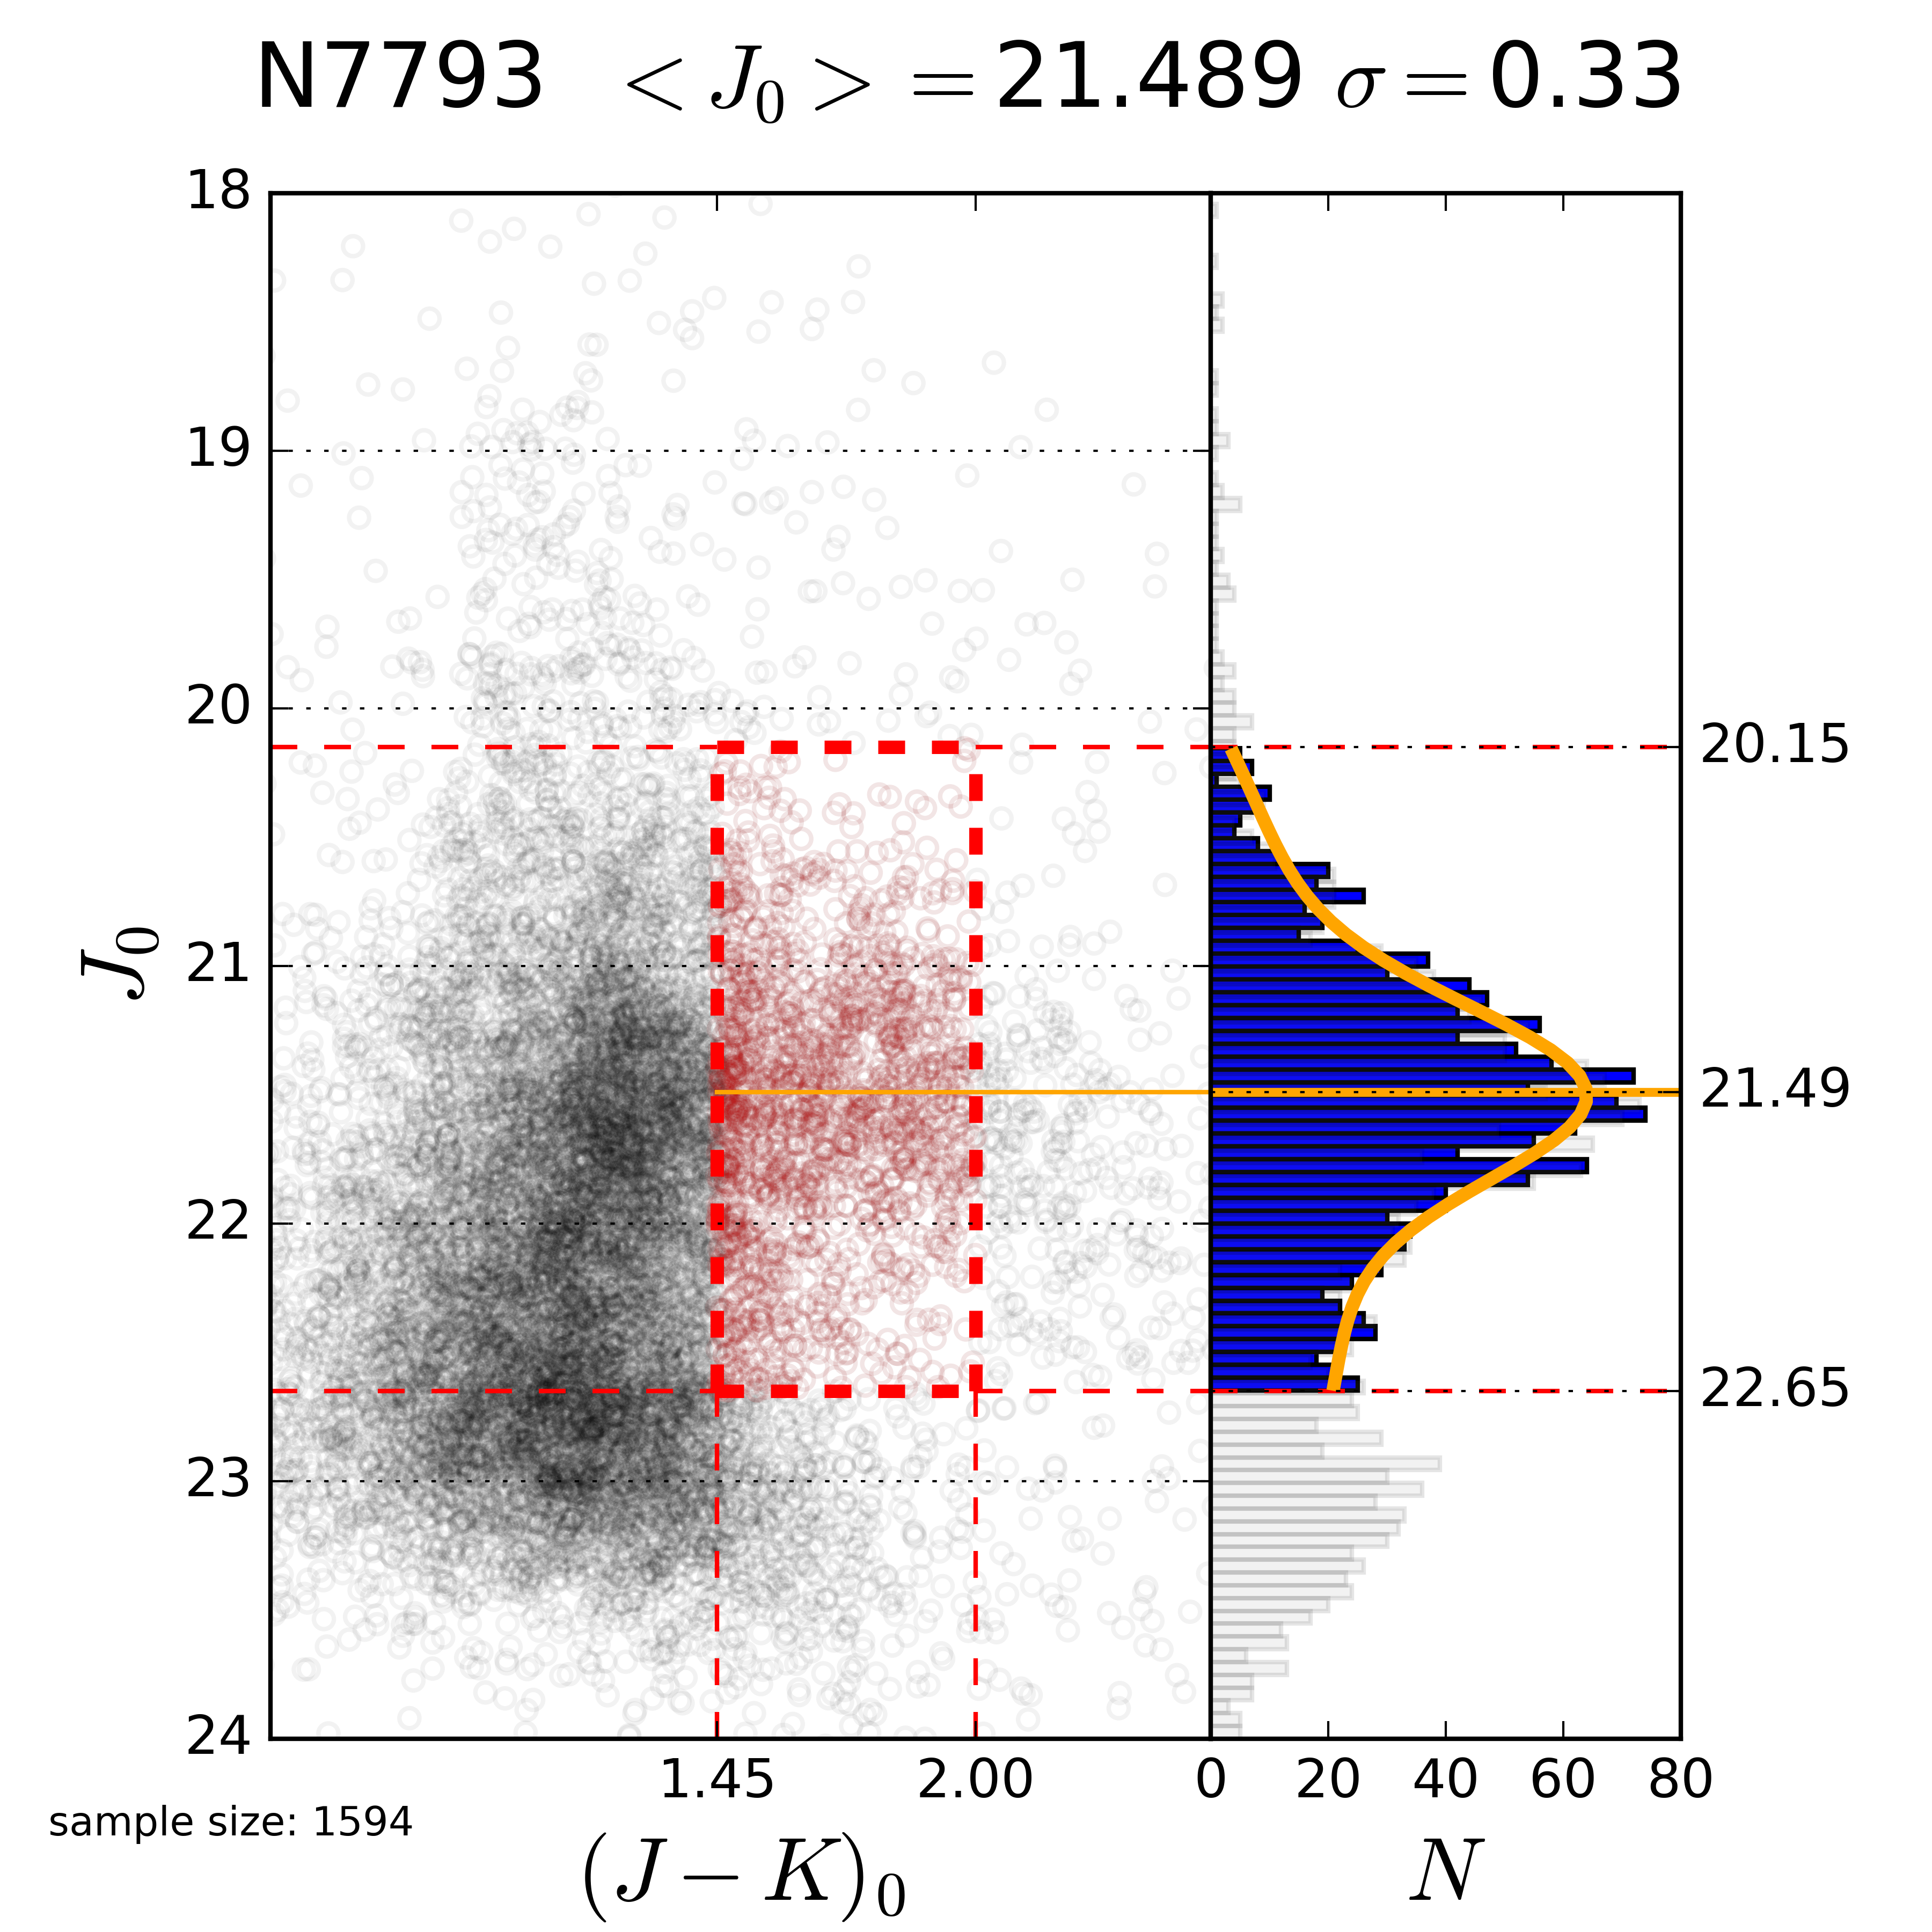
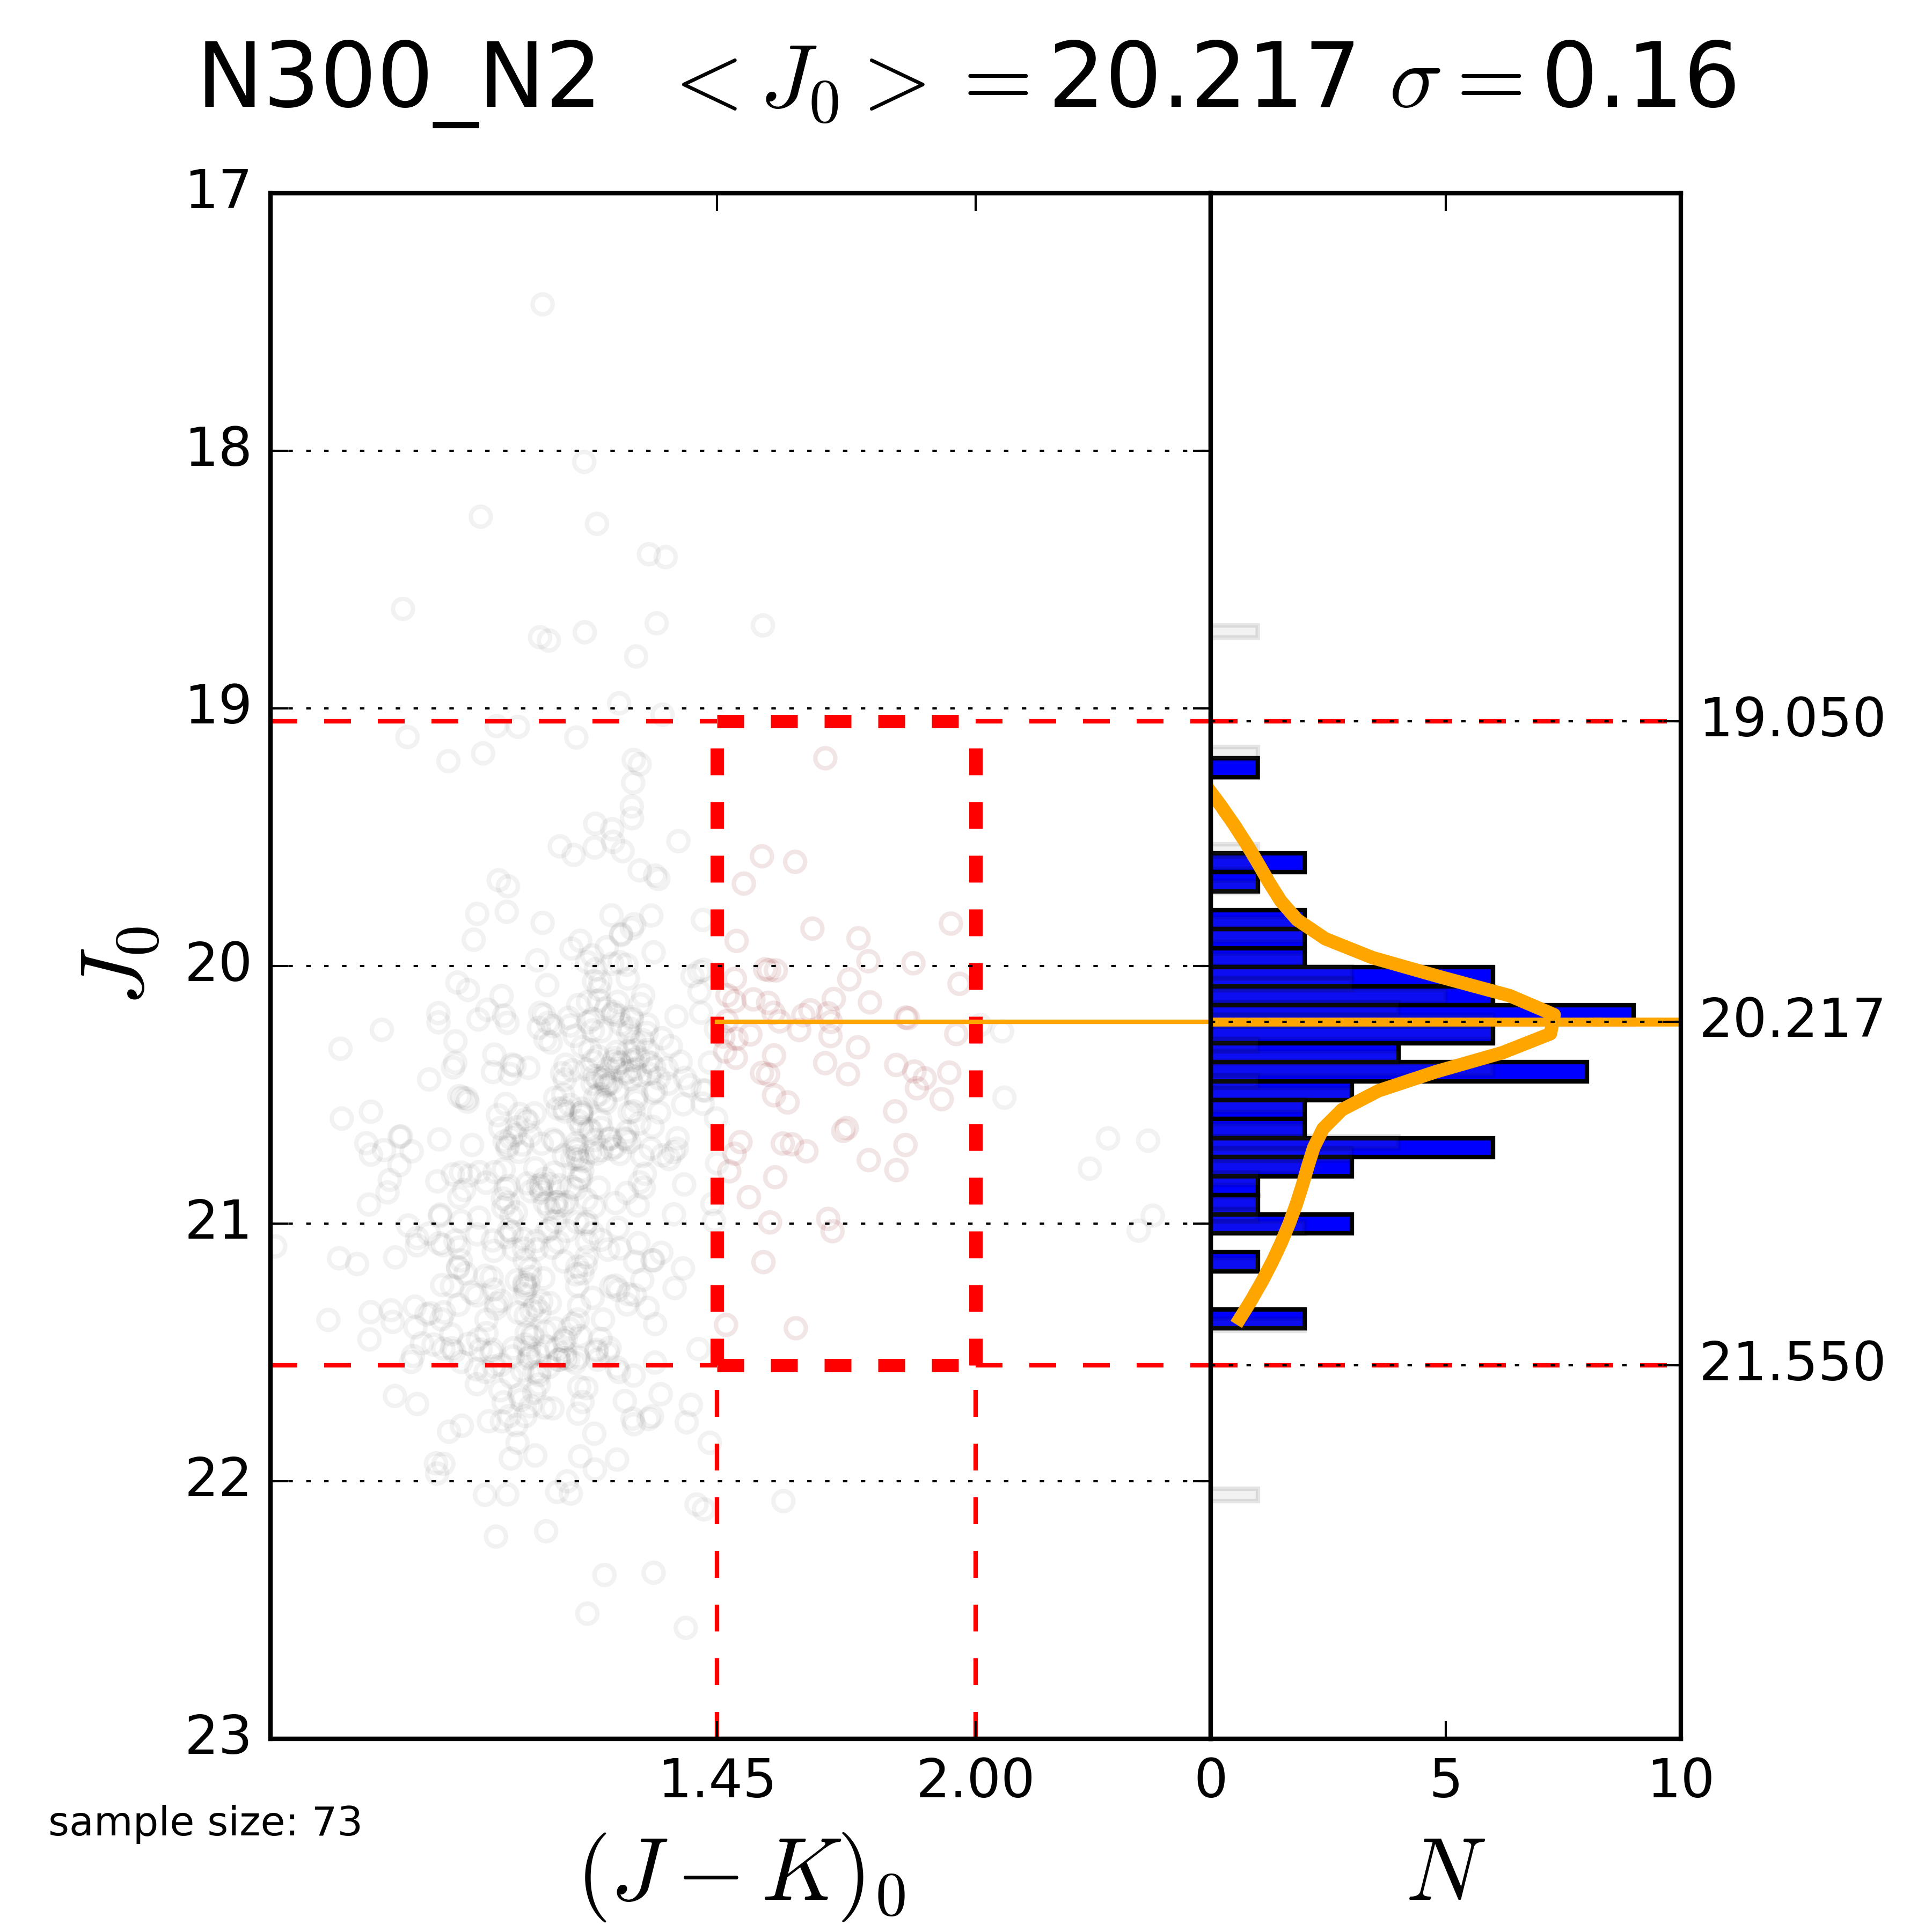
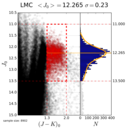
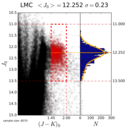
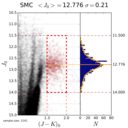
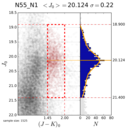
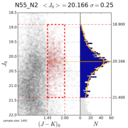
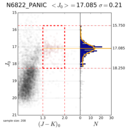
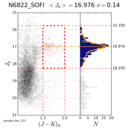
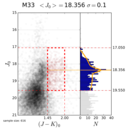
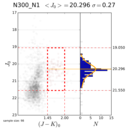
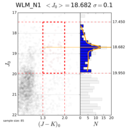
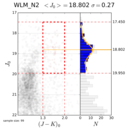
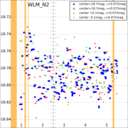
< J0 > determinations using profile fit
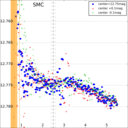
Color-magnitude diagrams with marked sample-selection boxes next to corresponding luminosity functions.
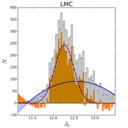
LMC,
(J-K)0∈(1.3 m, 2.0 m) |
LMC,
(J-K)0∈(1.45 m, 2.0 m) |
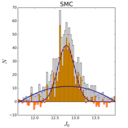
SMC |
N3109 |
N247 |
N55
1st night |
N55
2nd night |
N6822
PANIC |
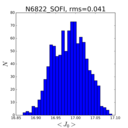
N6822
SOFI |
N7793 |
M33 |
N300
1st night |
N300
2nd night |
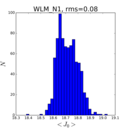
WLM
1st night |
WLM
2nd night |
 |
 |
 |
 |
 |
 |
 |
 |
 |
 |
 |
 |
 |
 |
 |
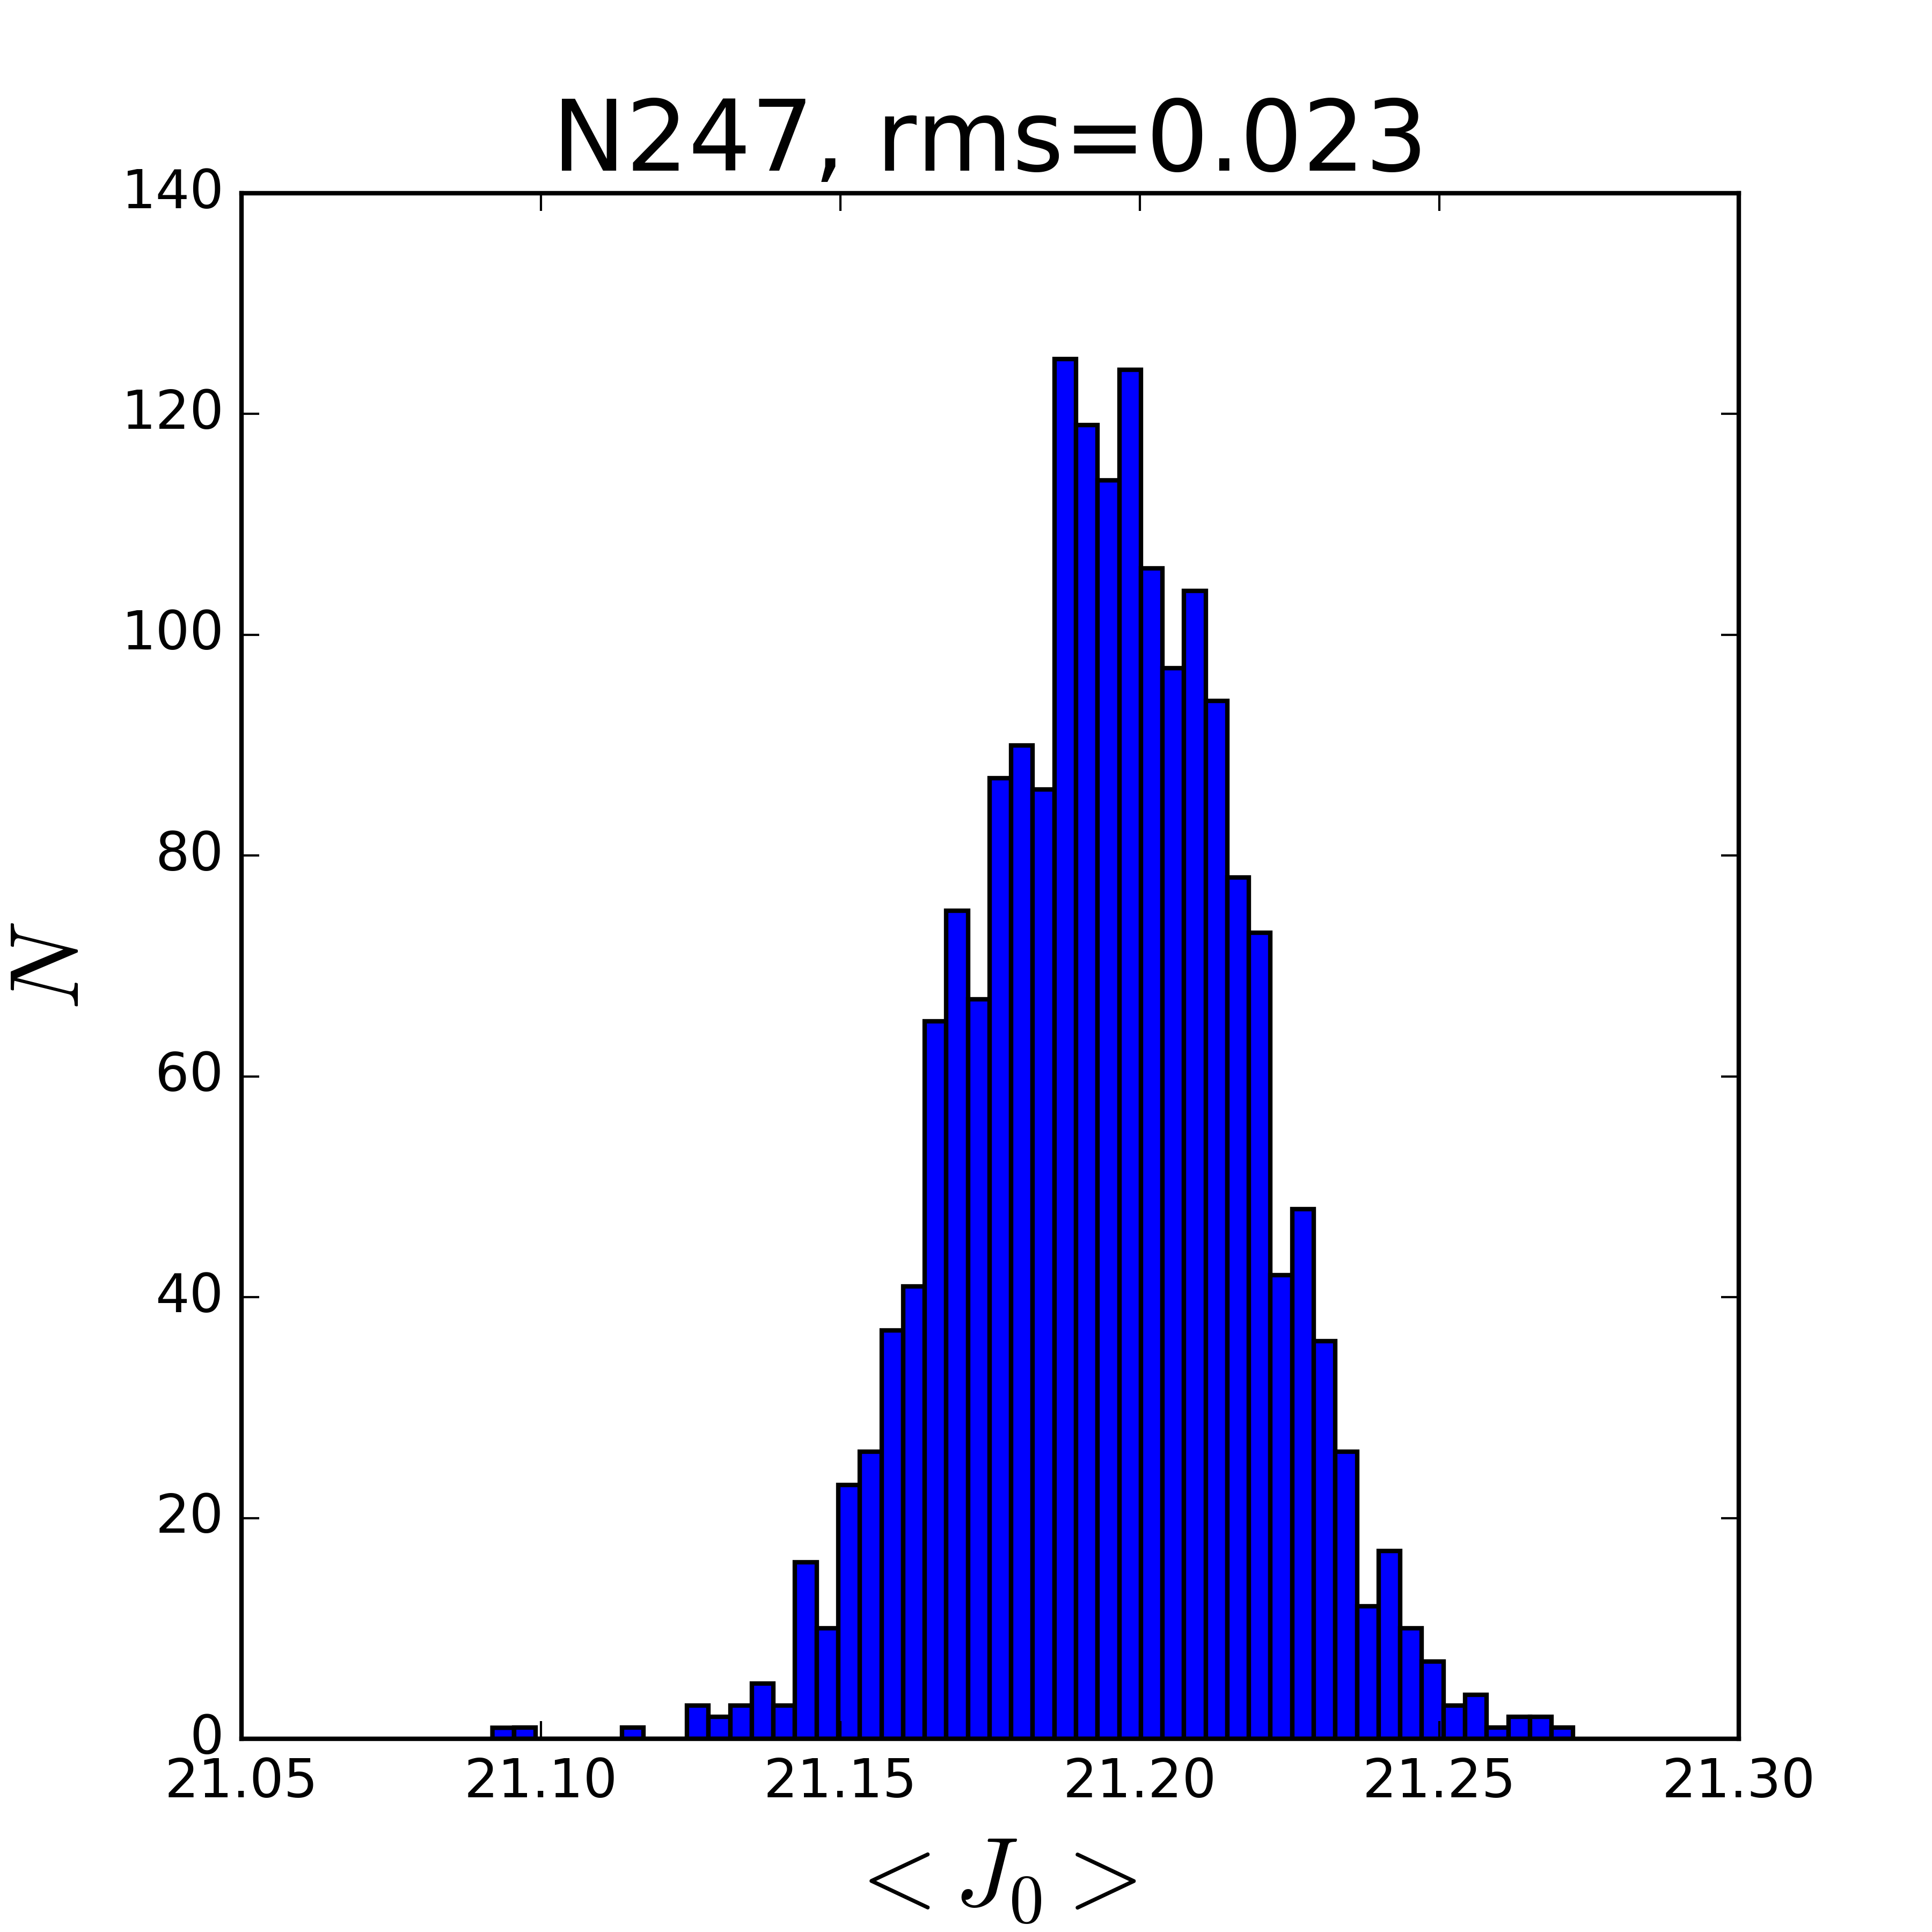
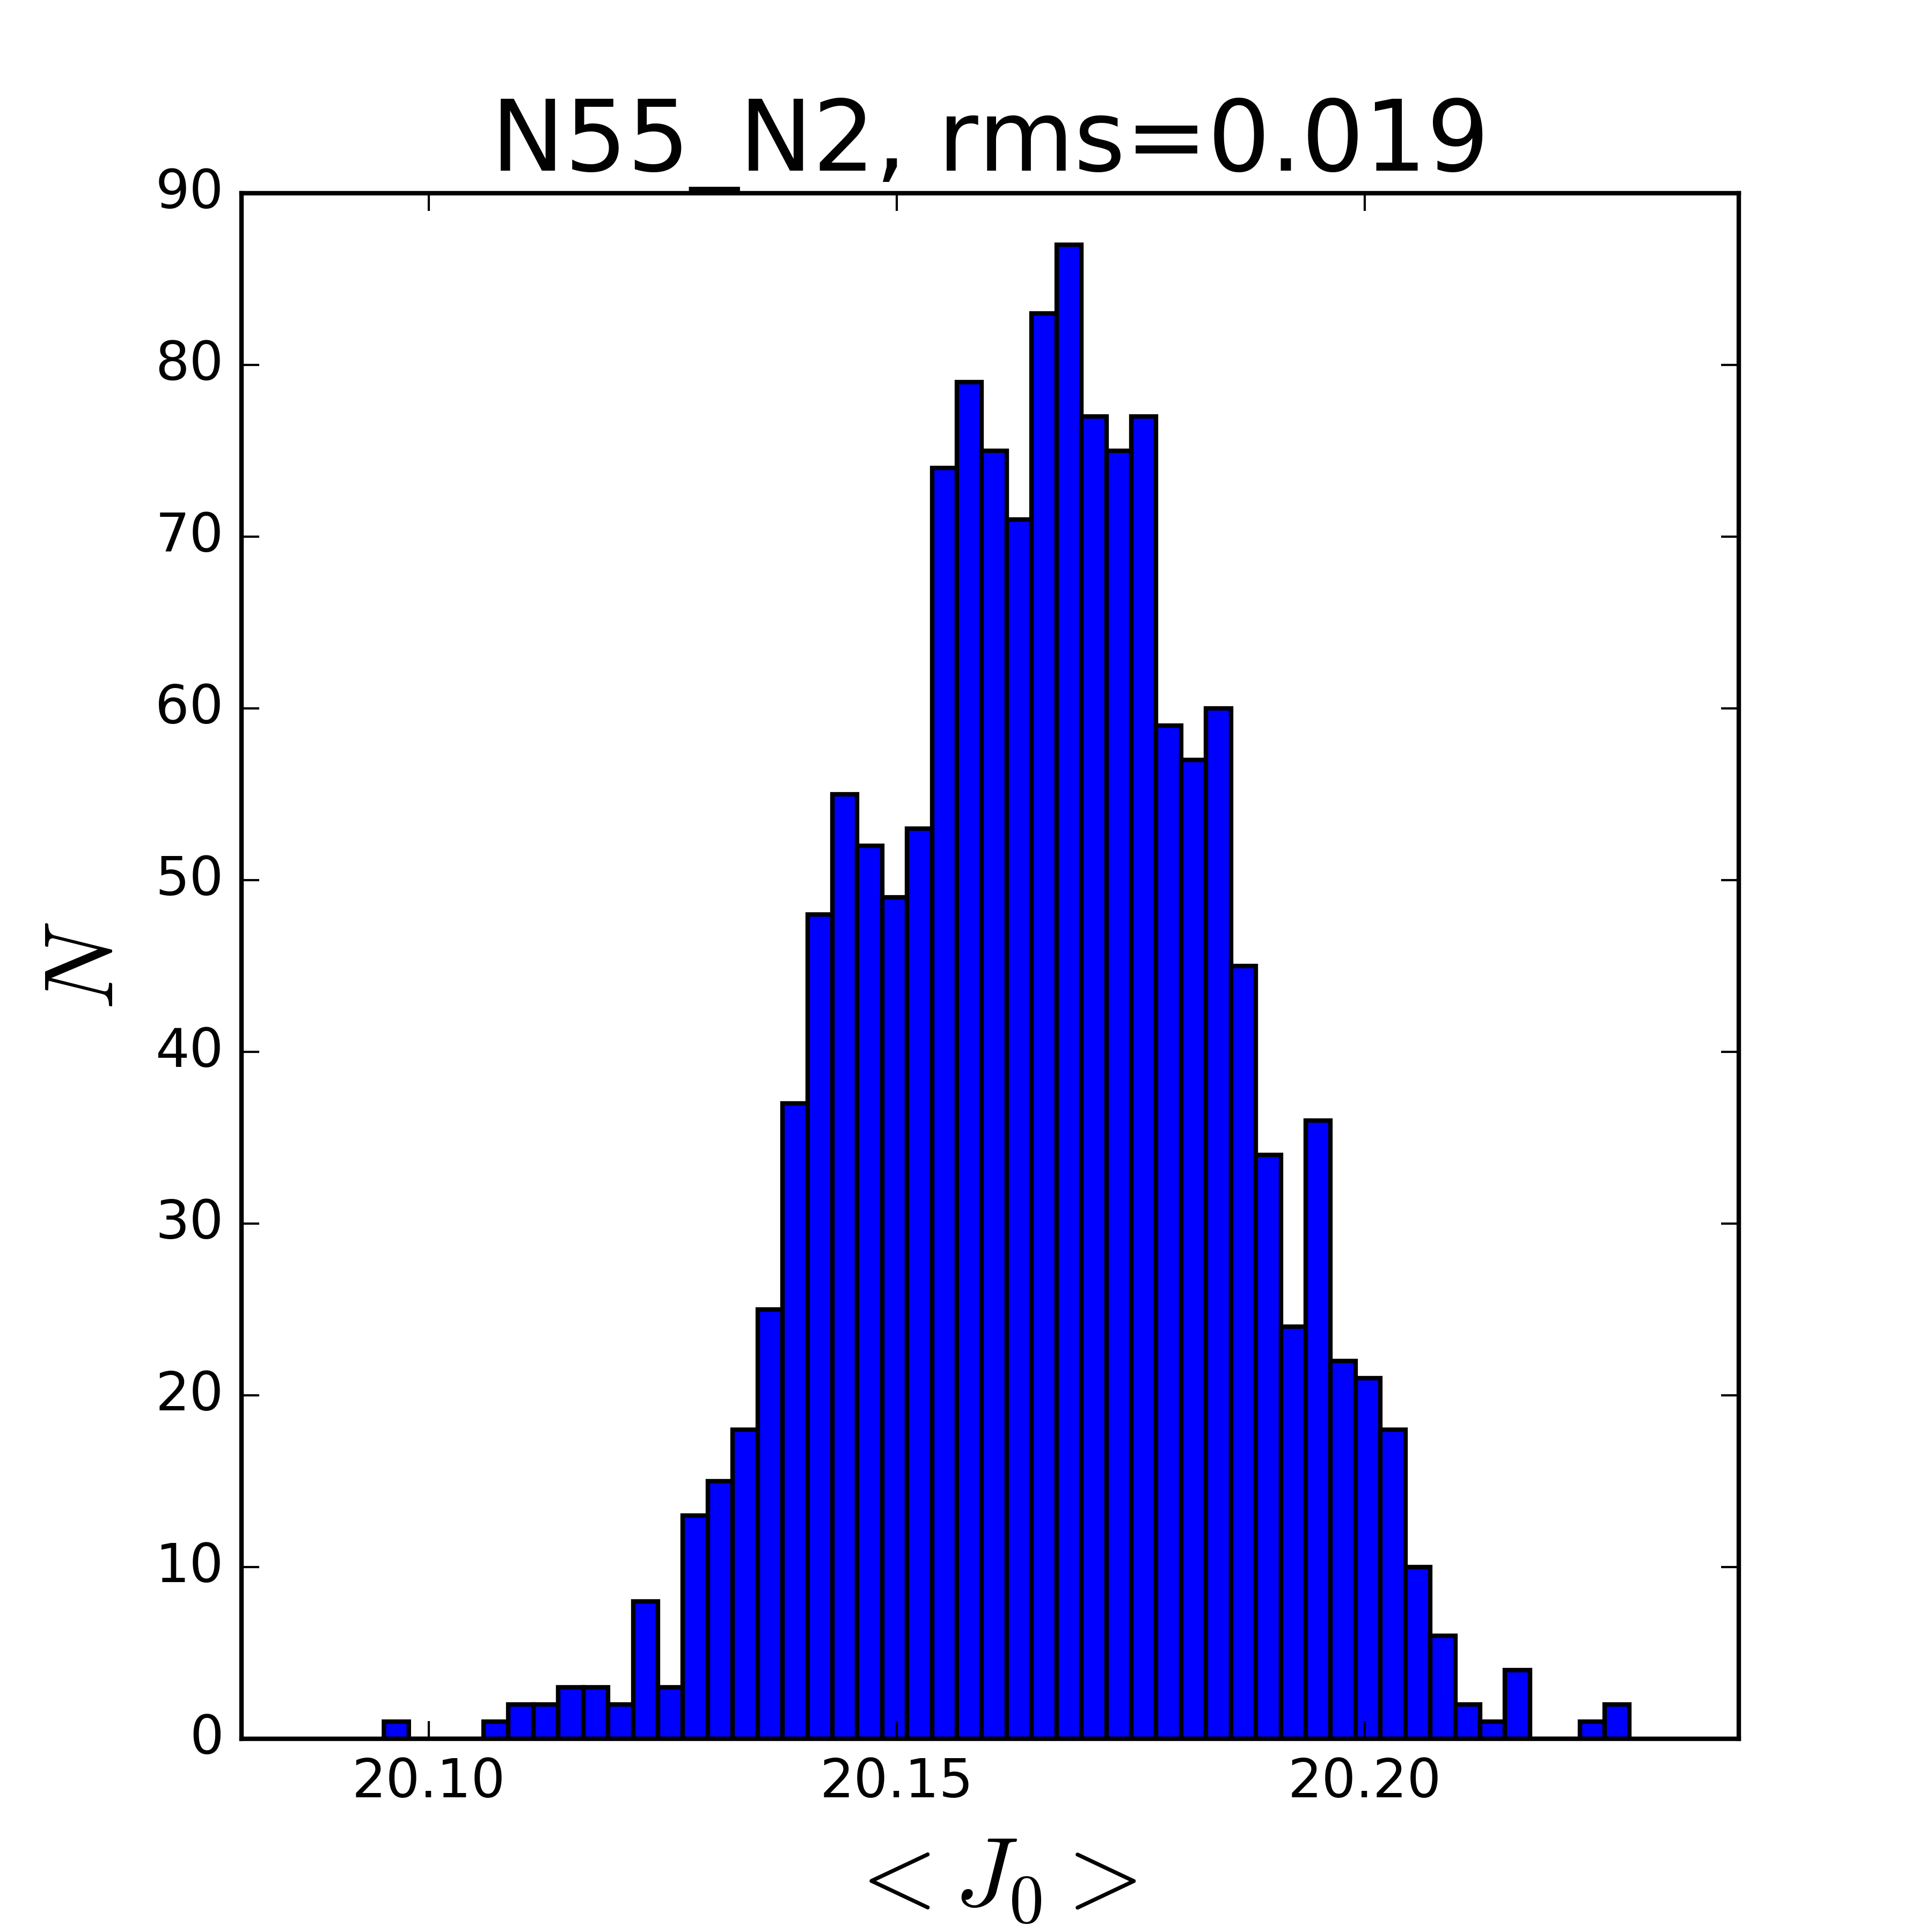
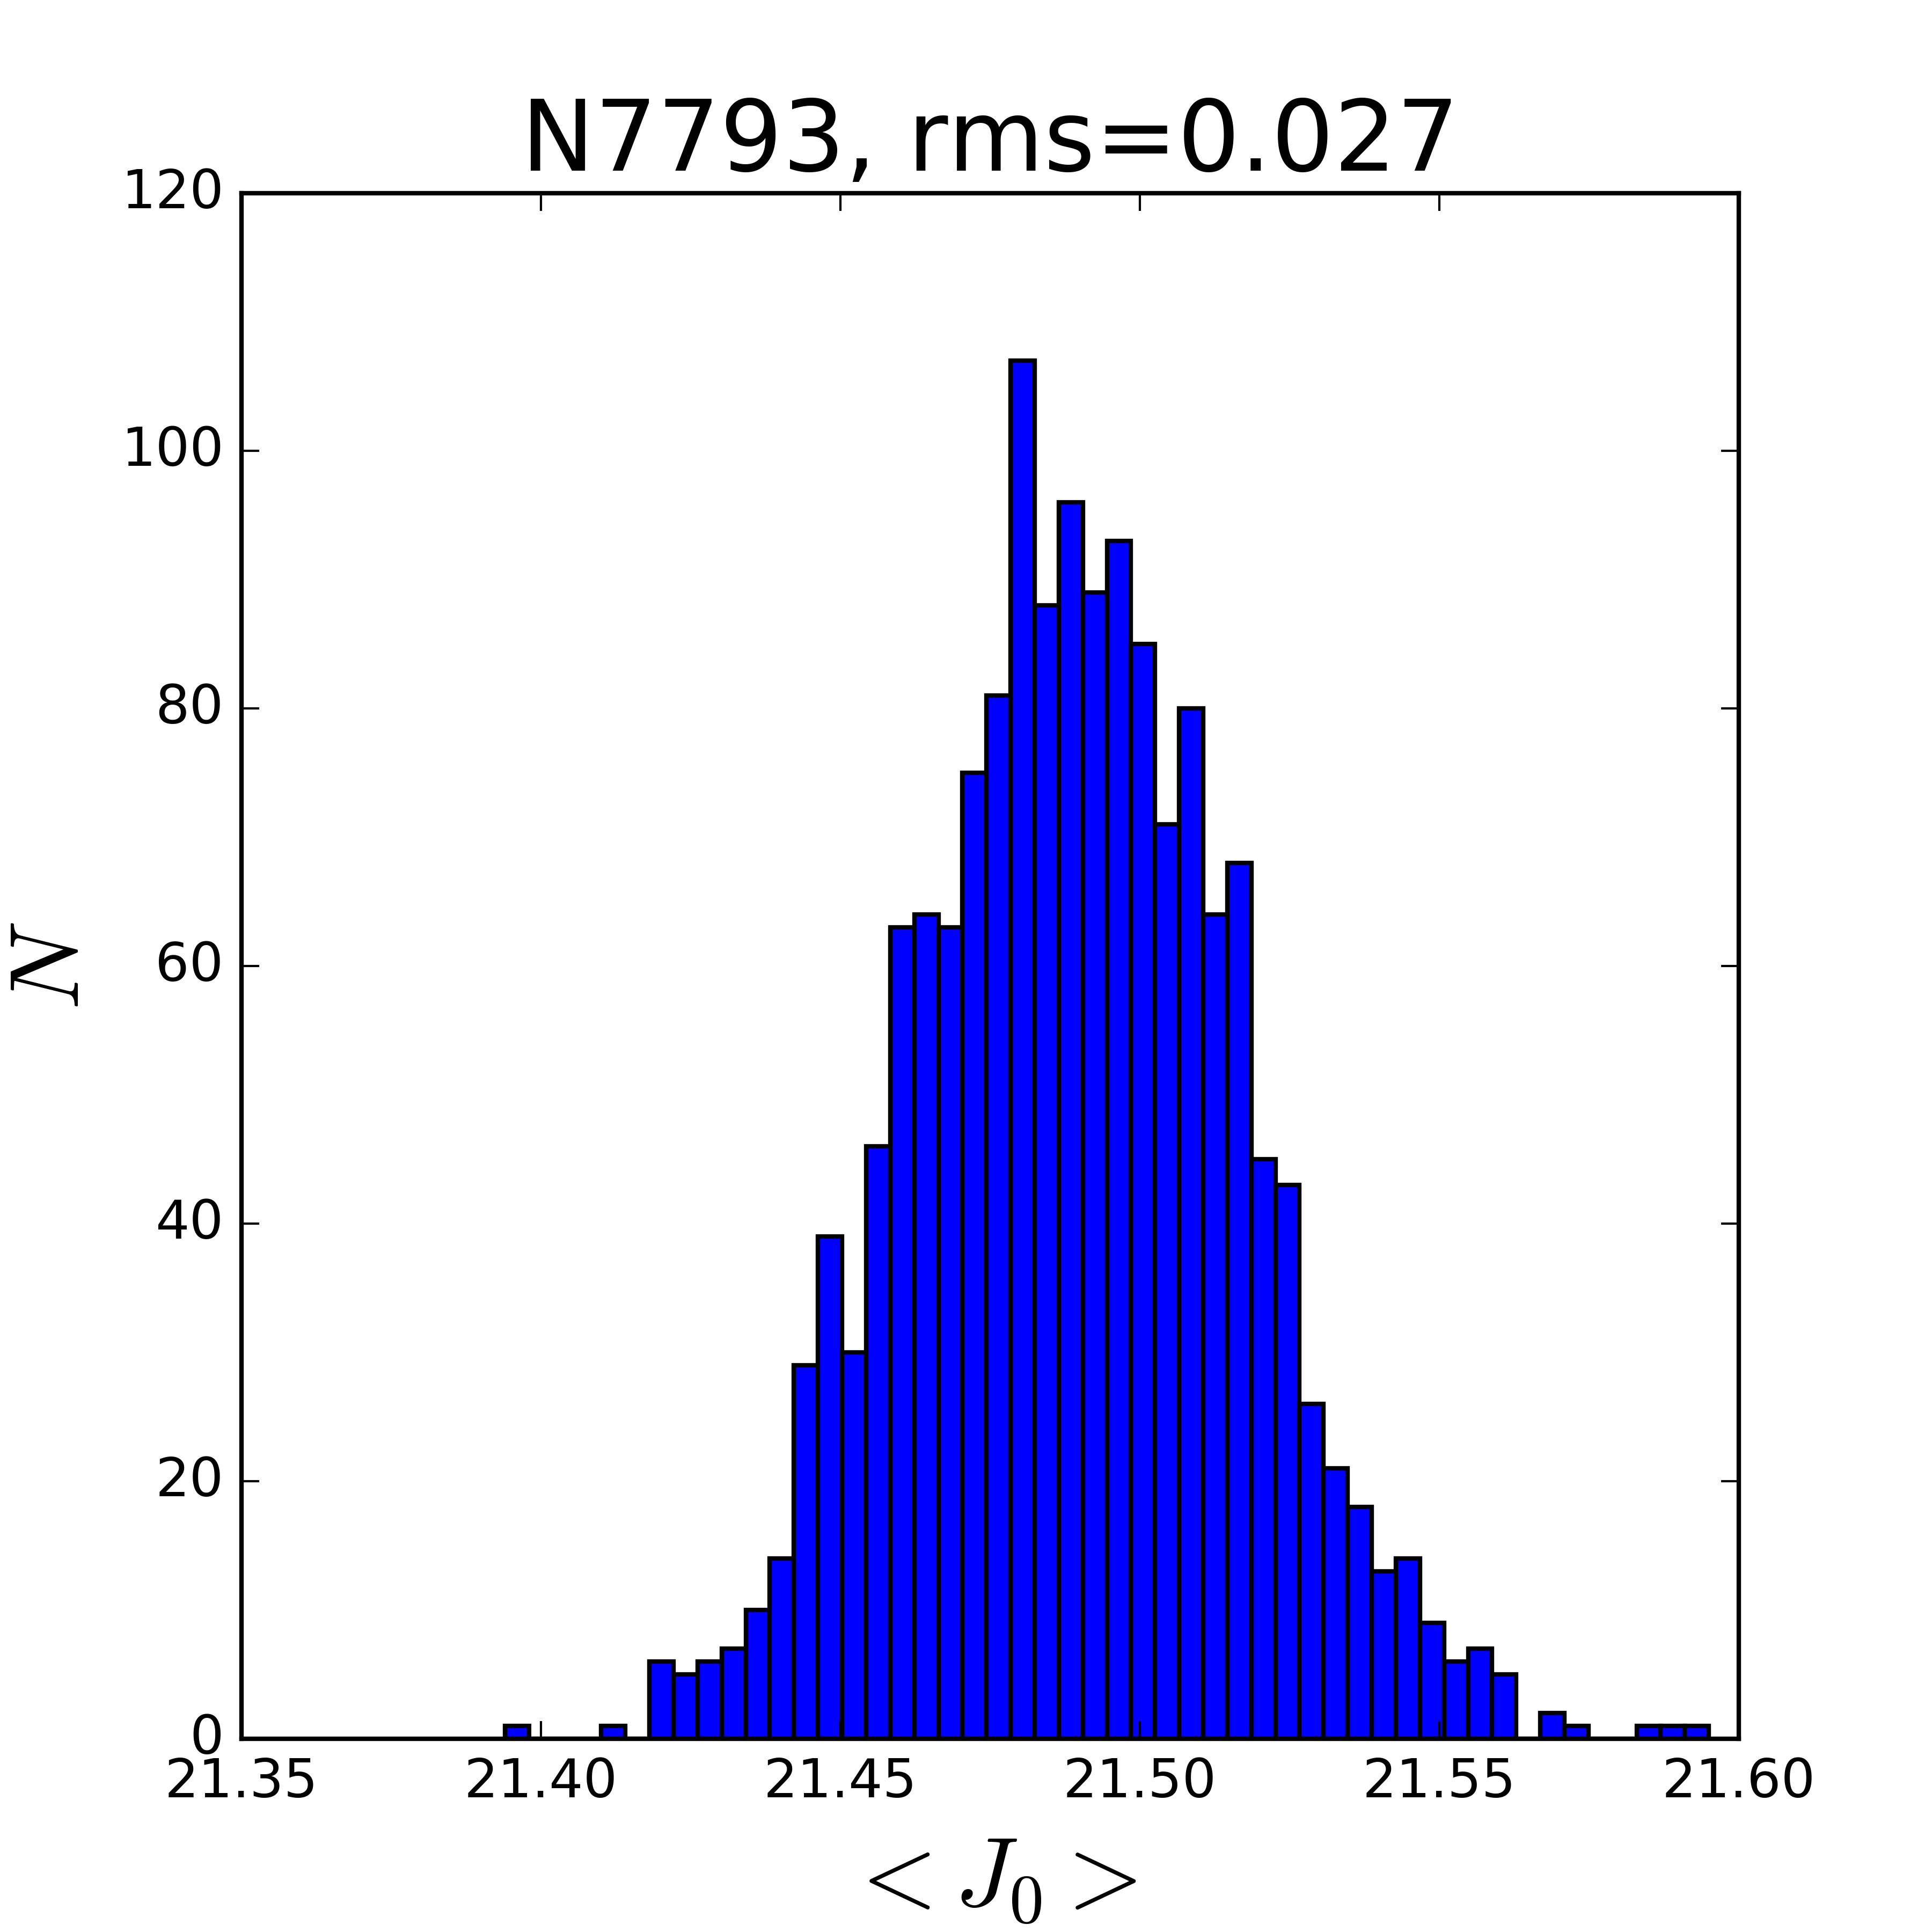
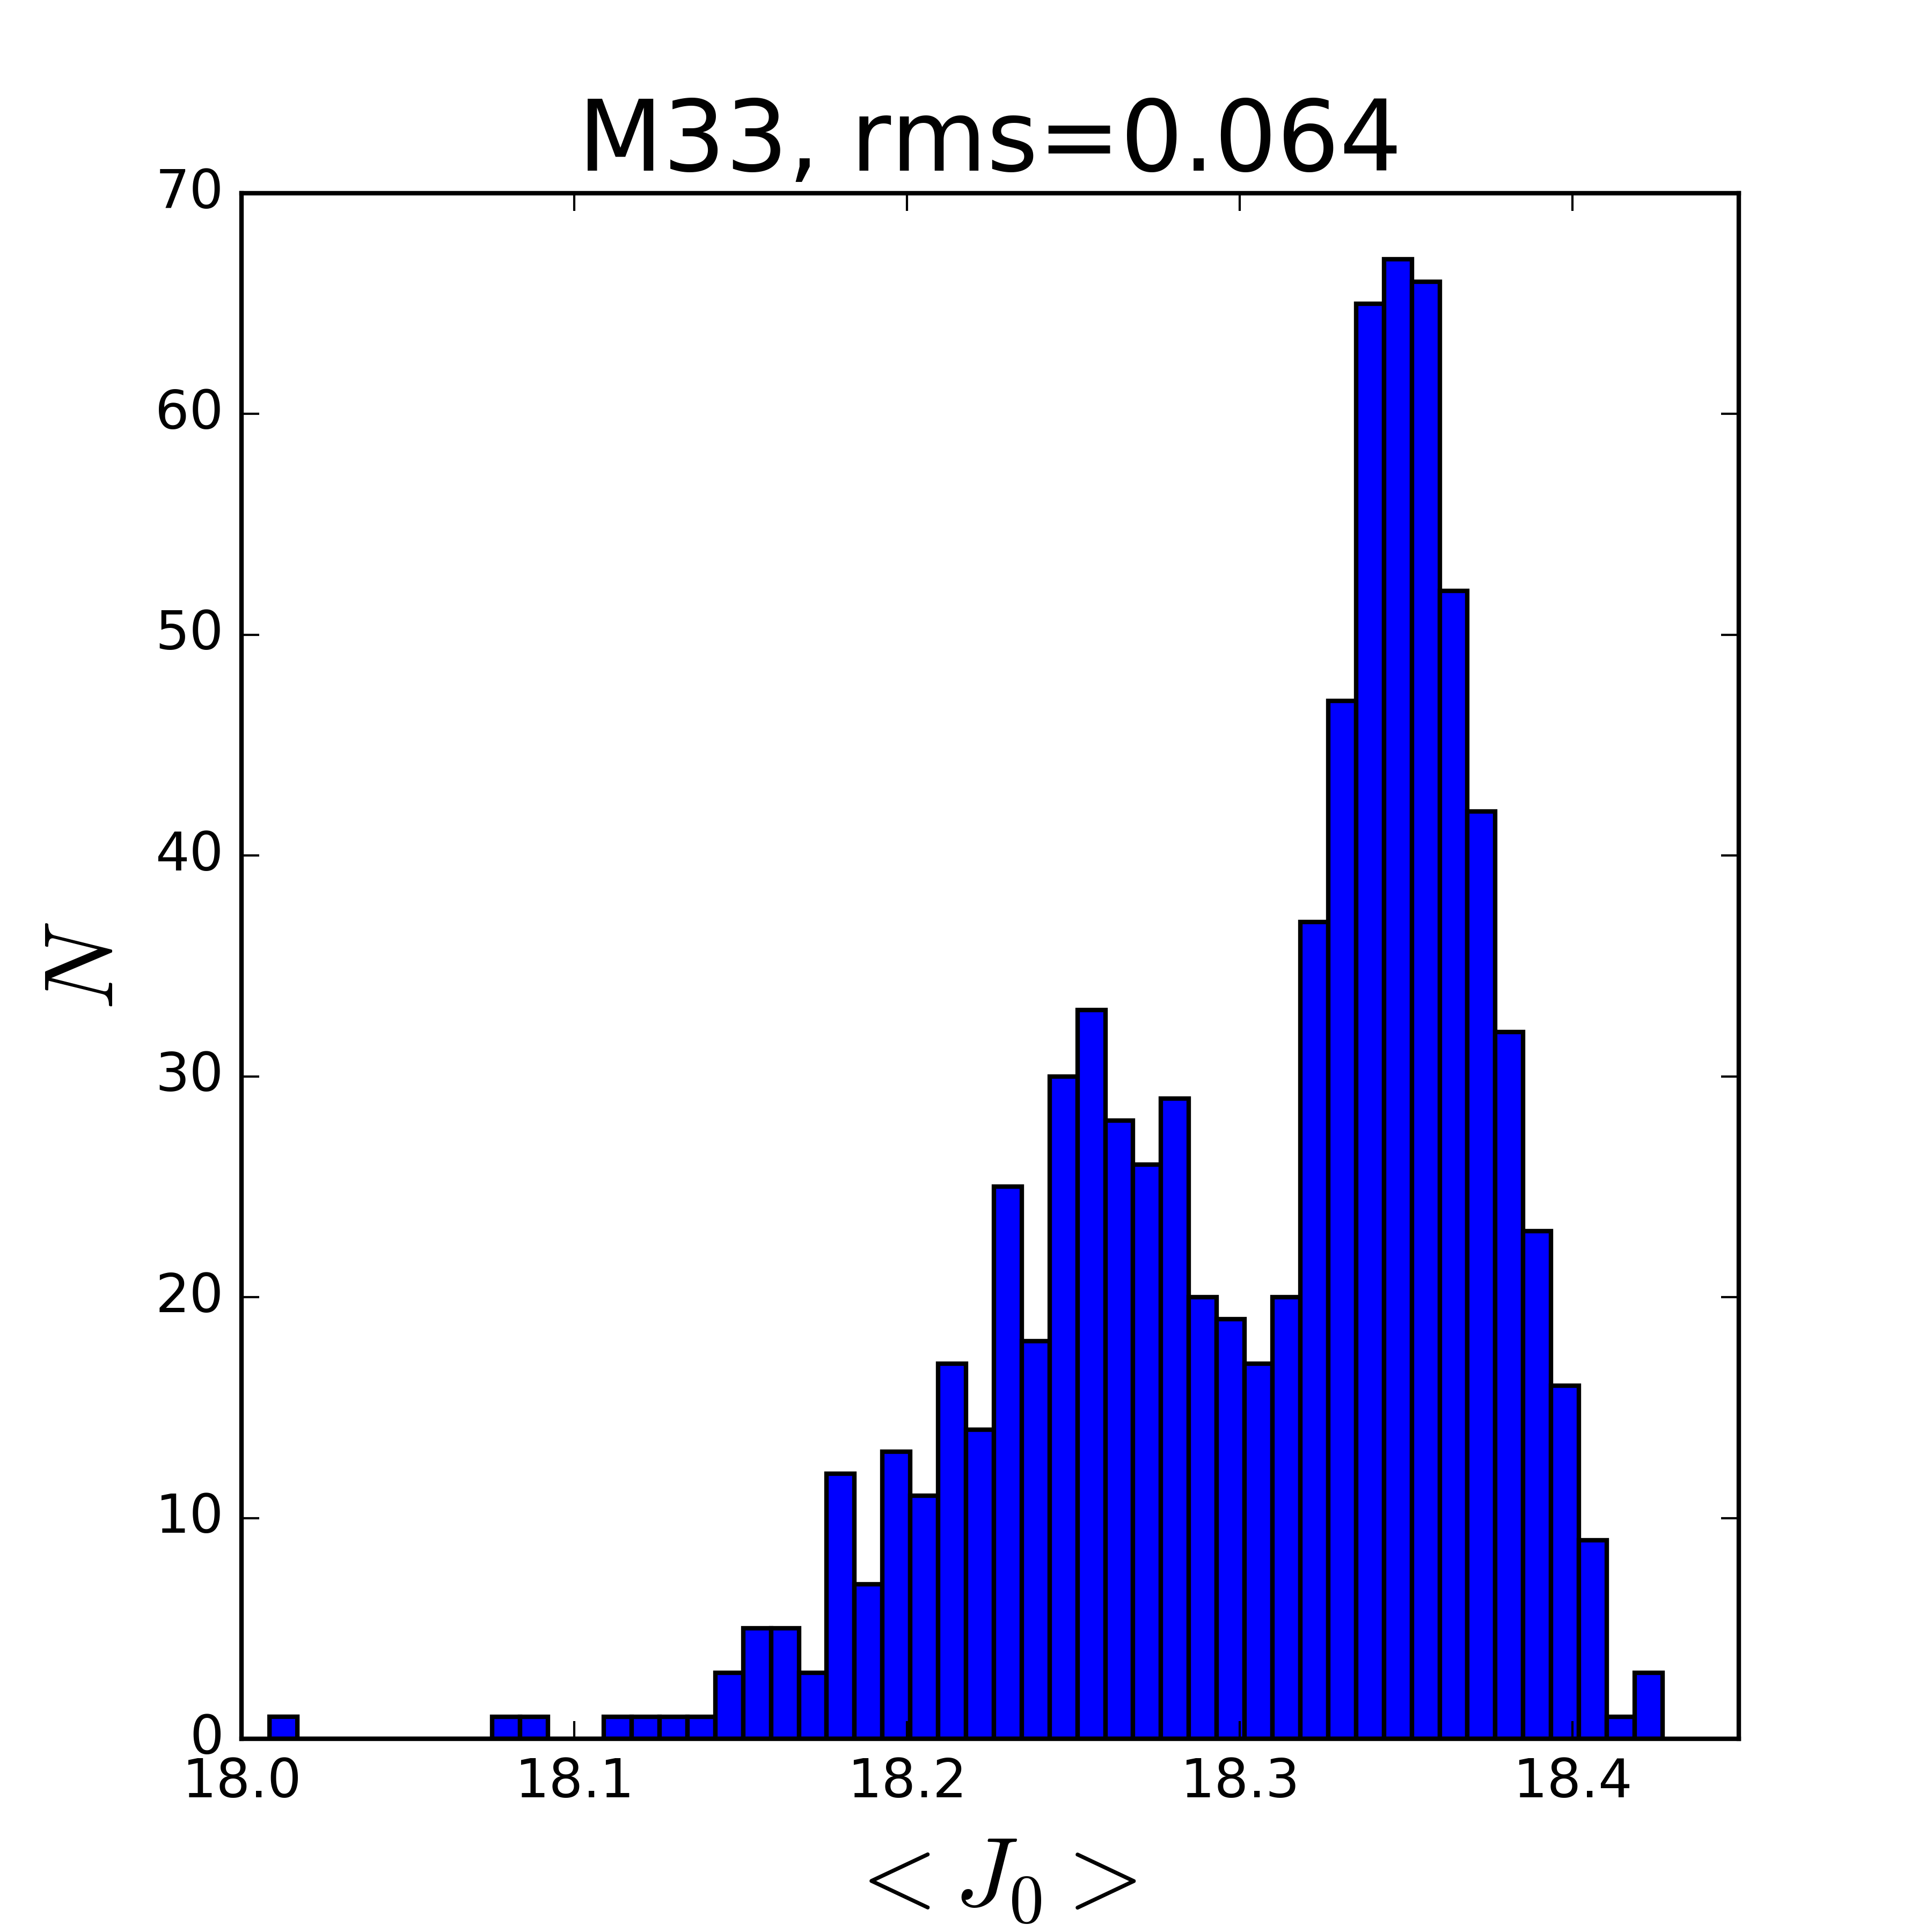
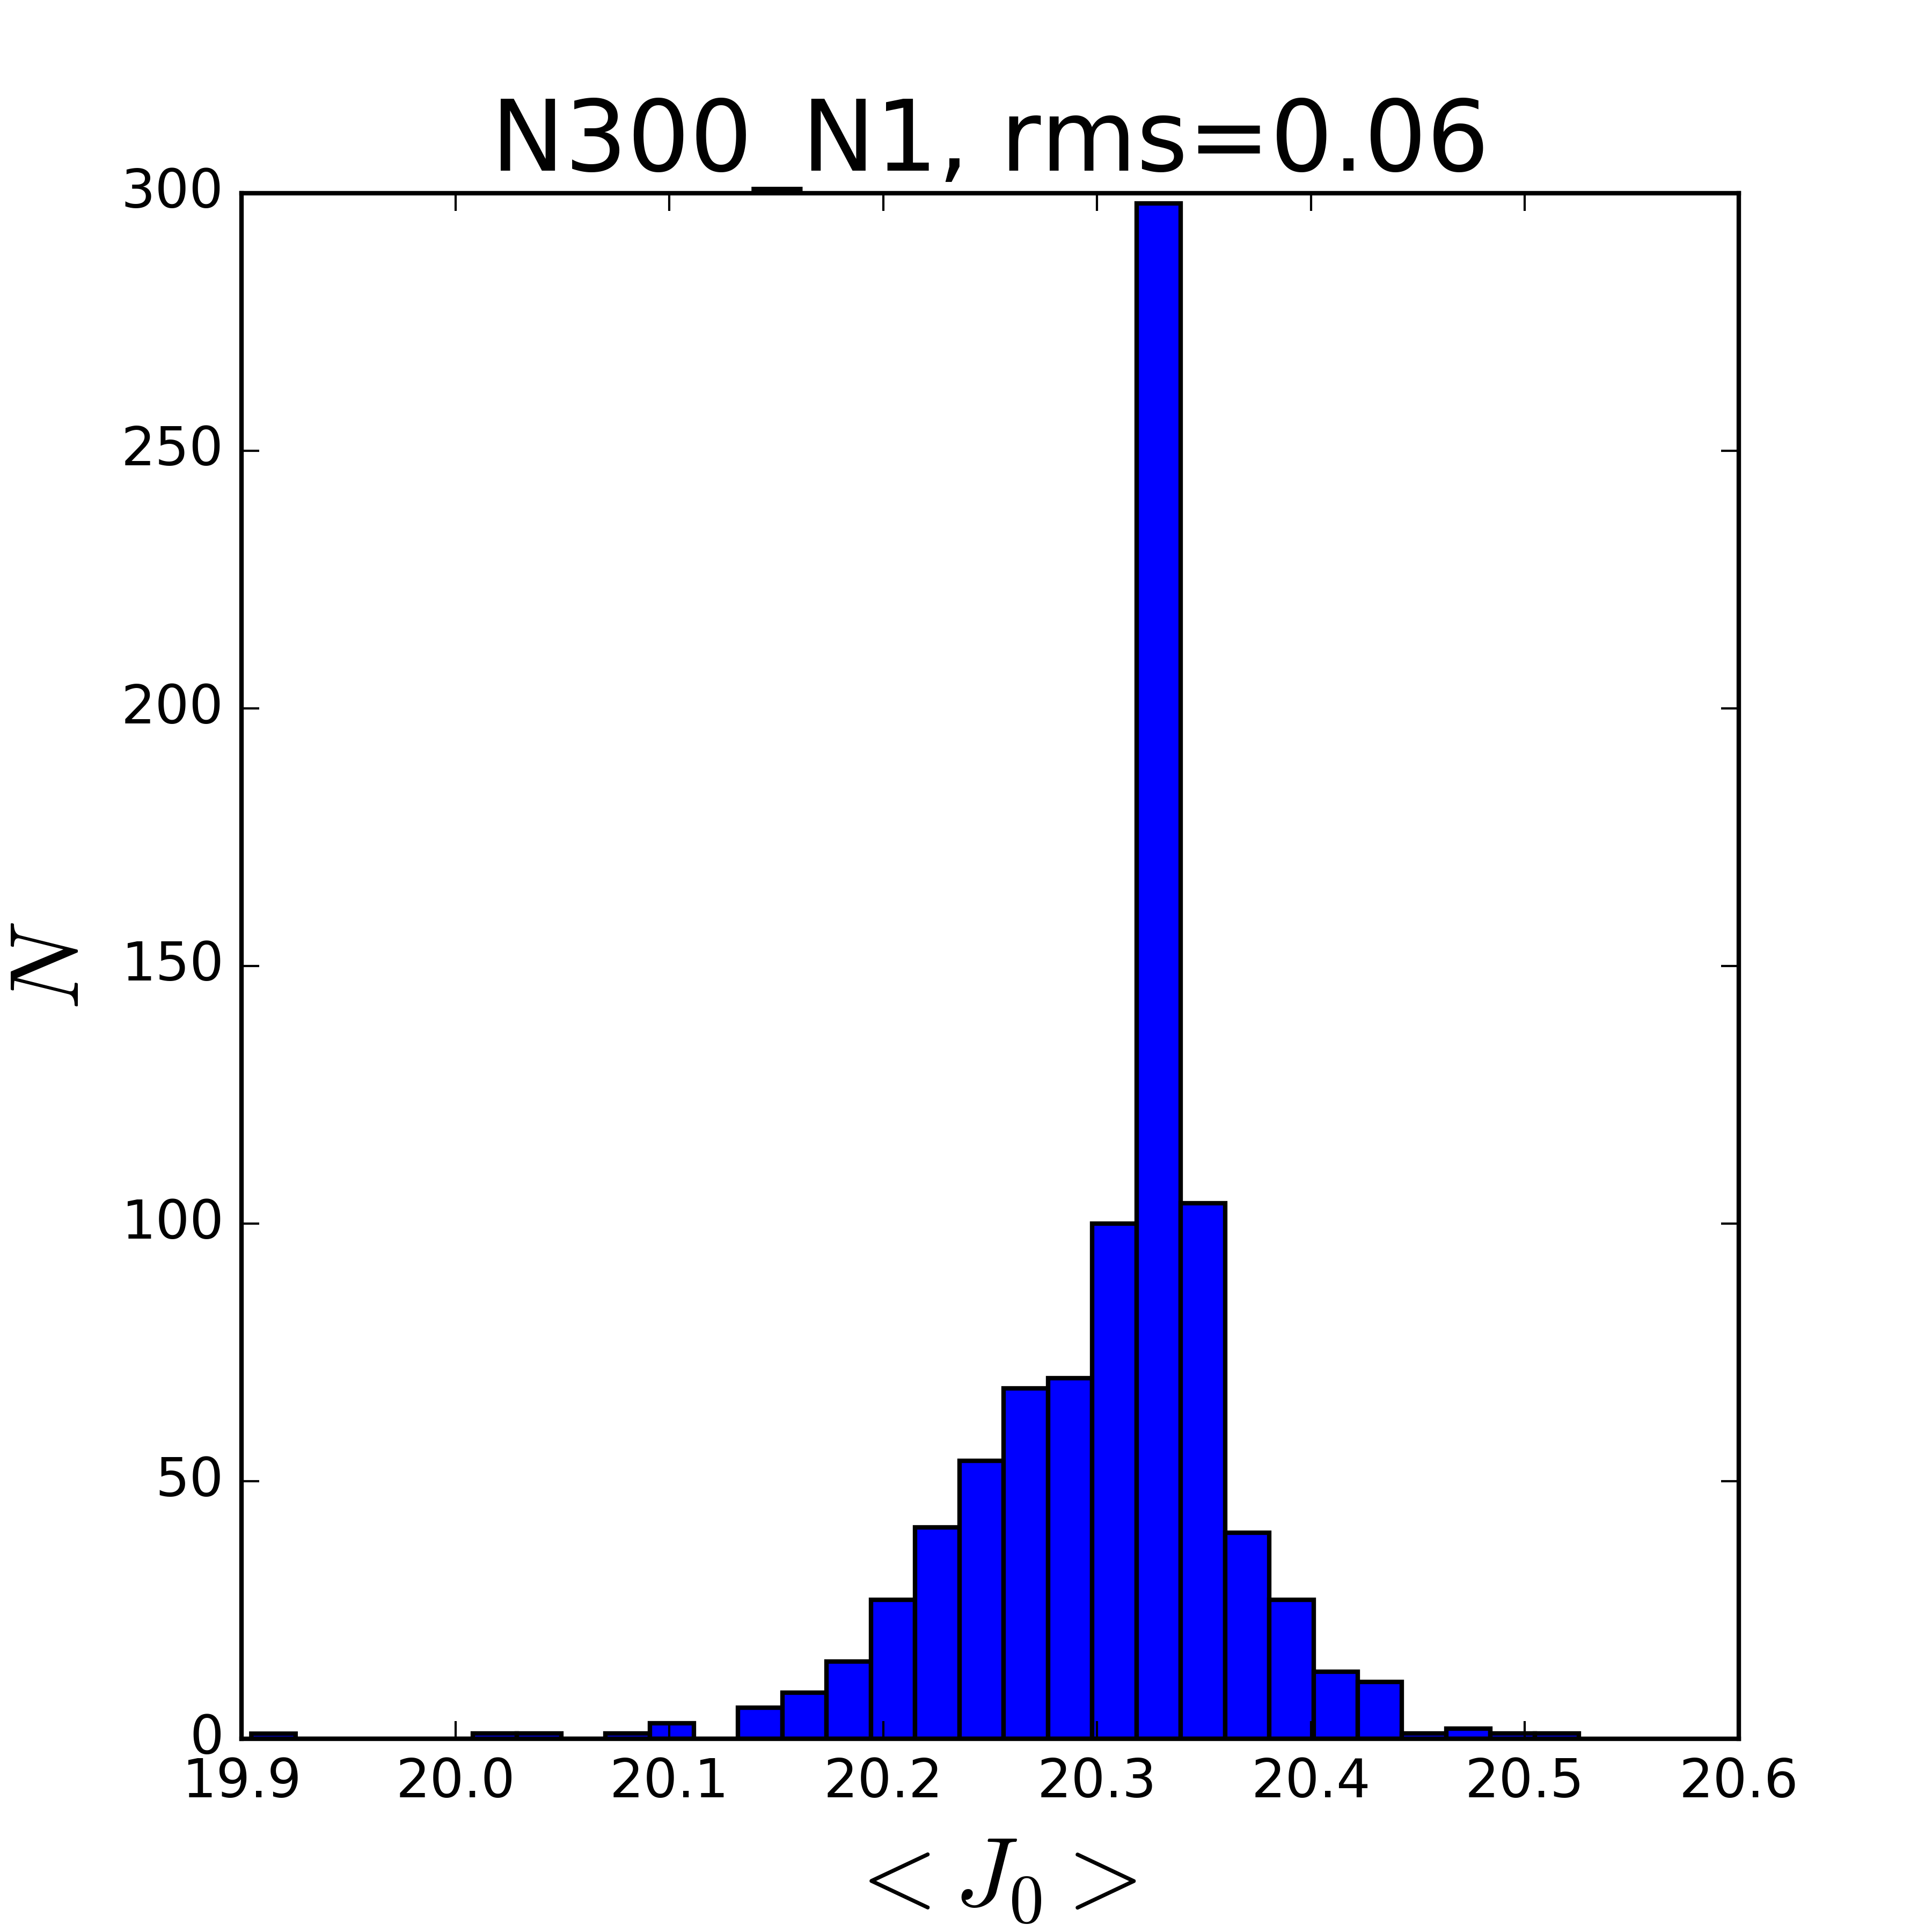
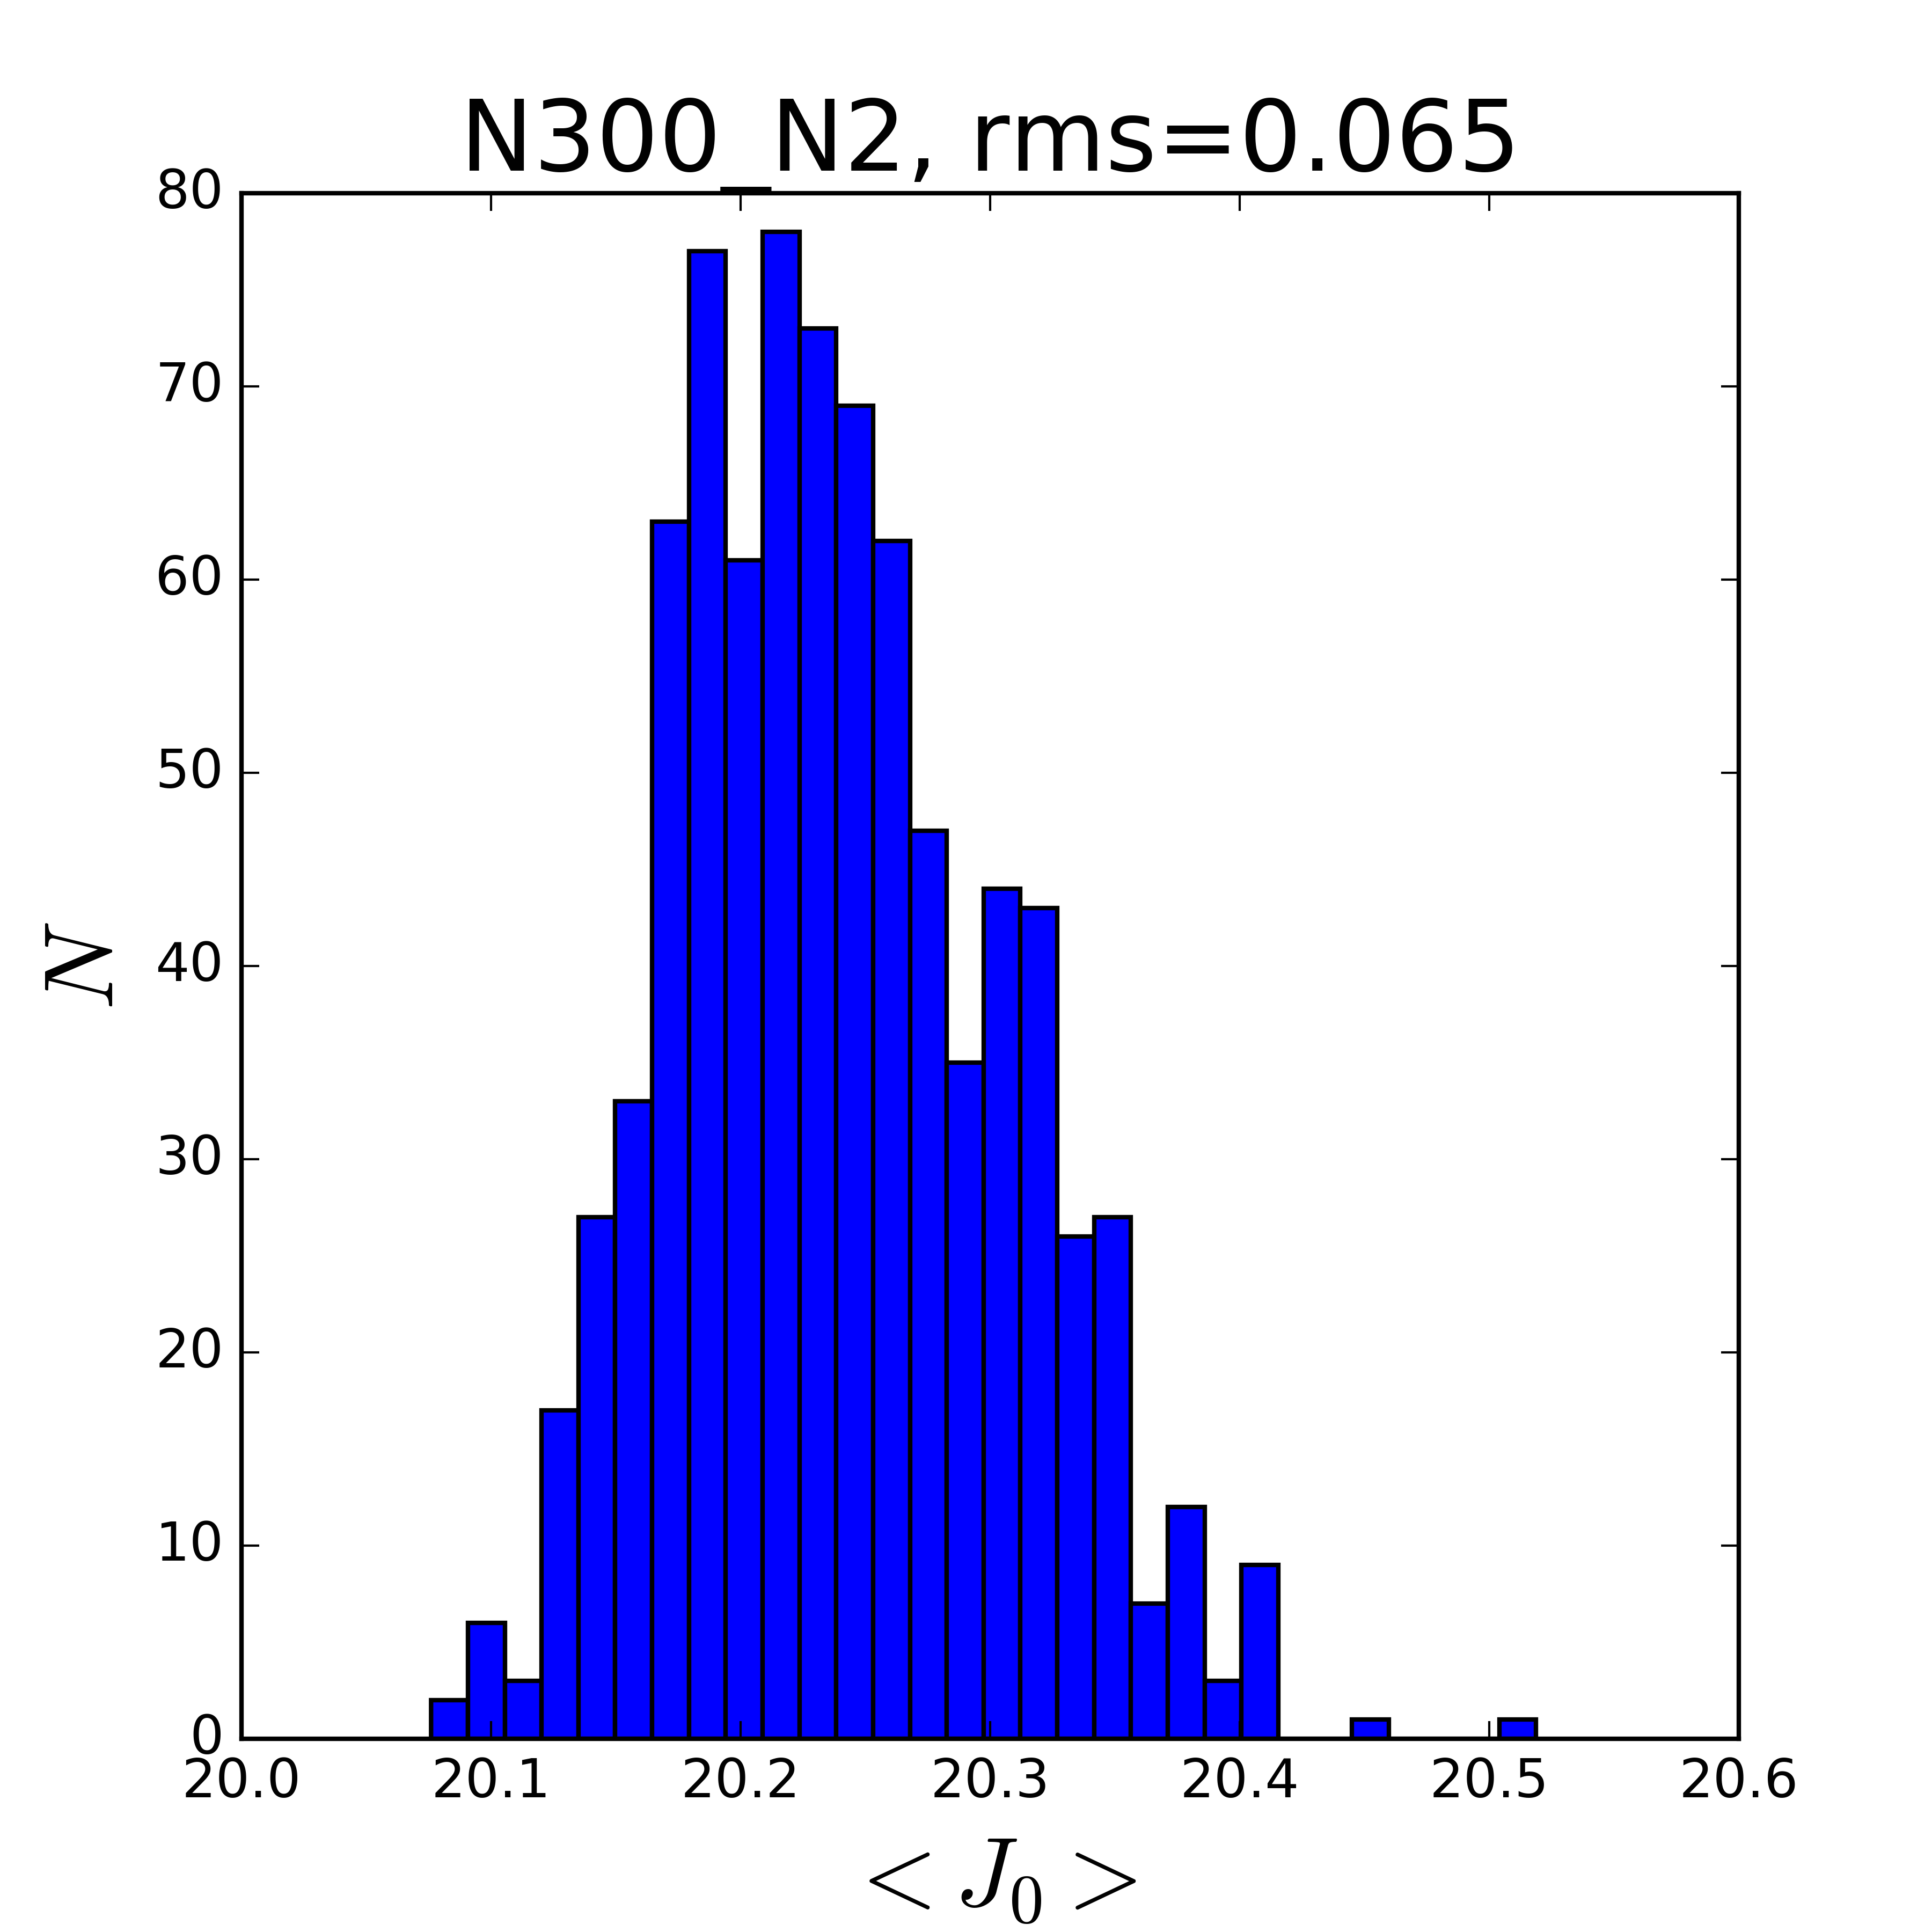
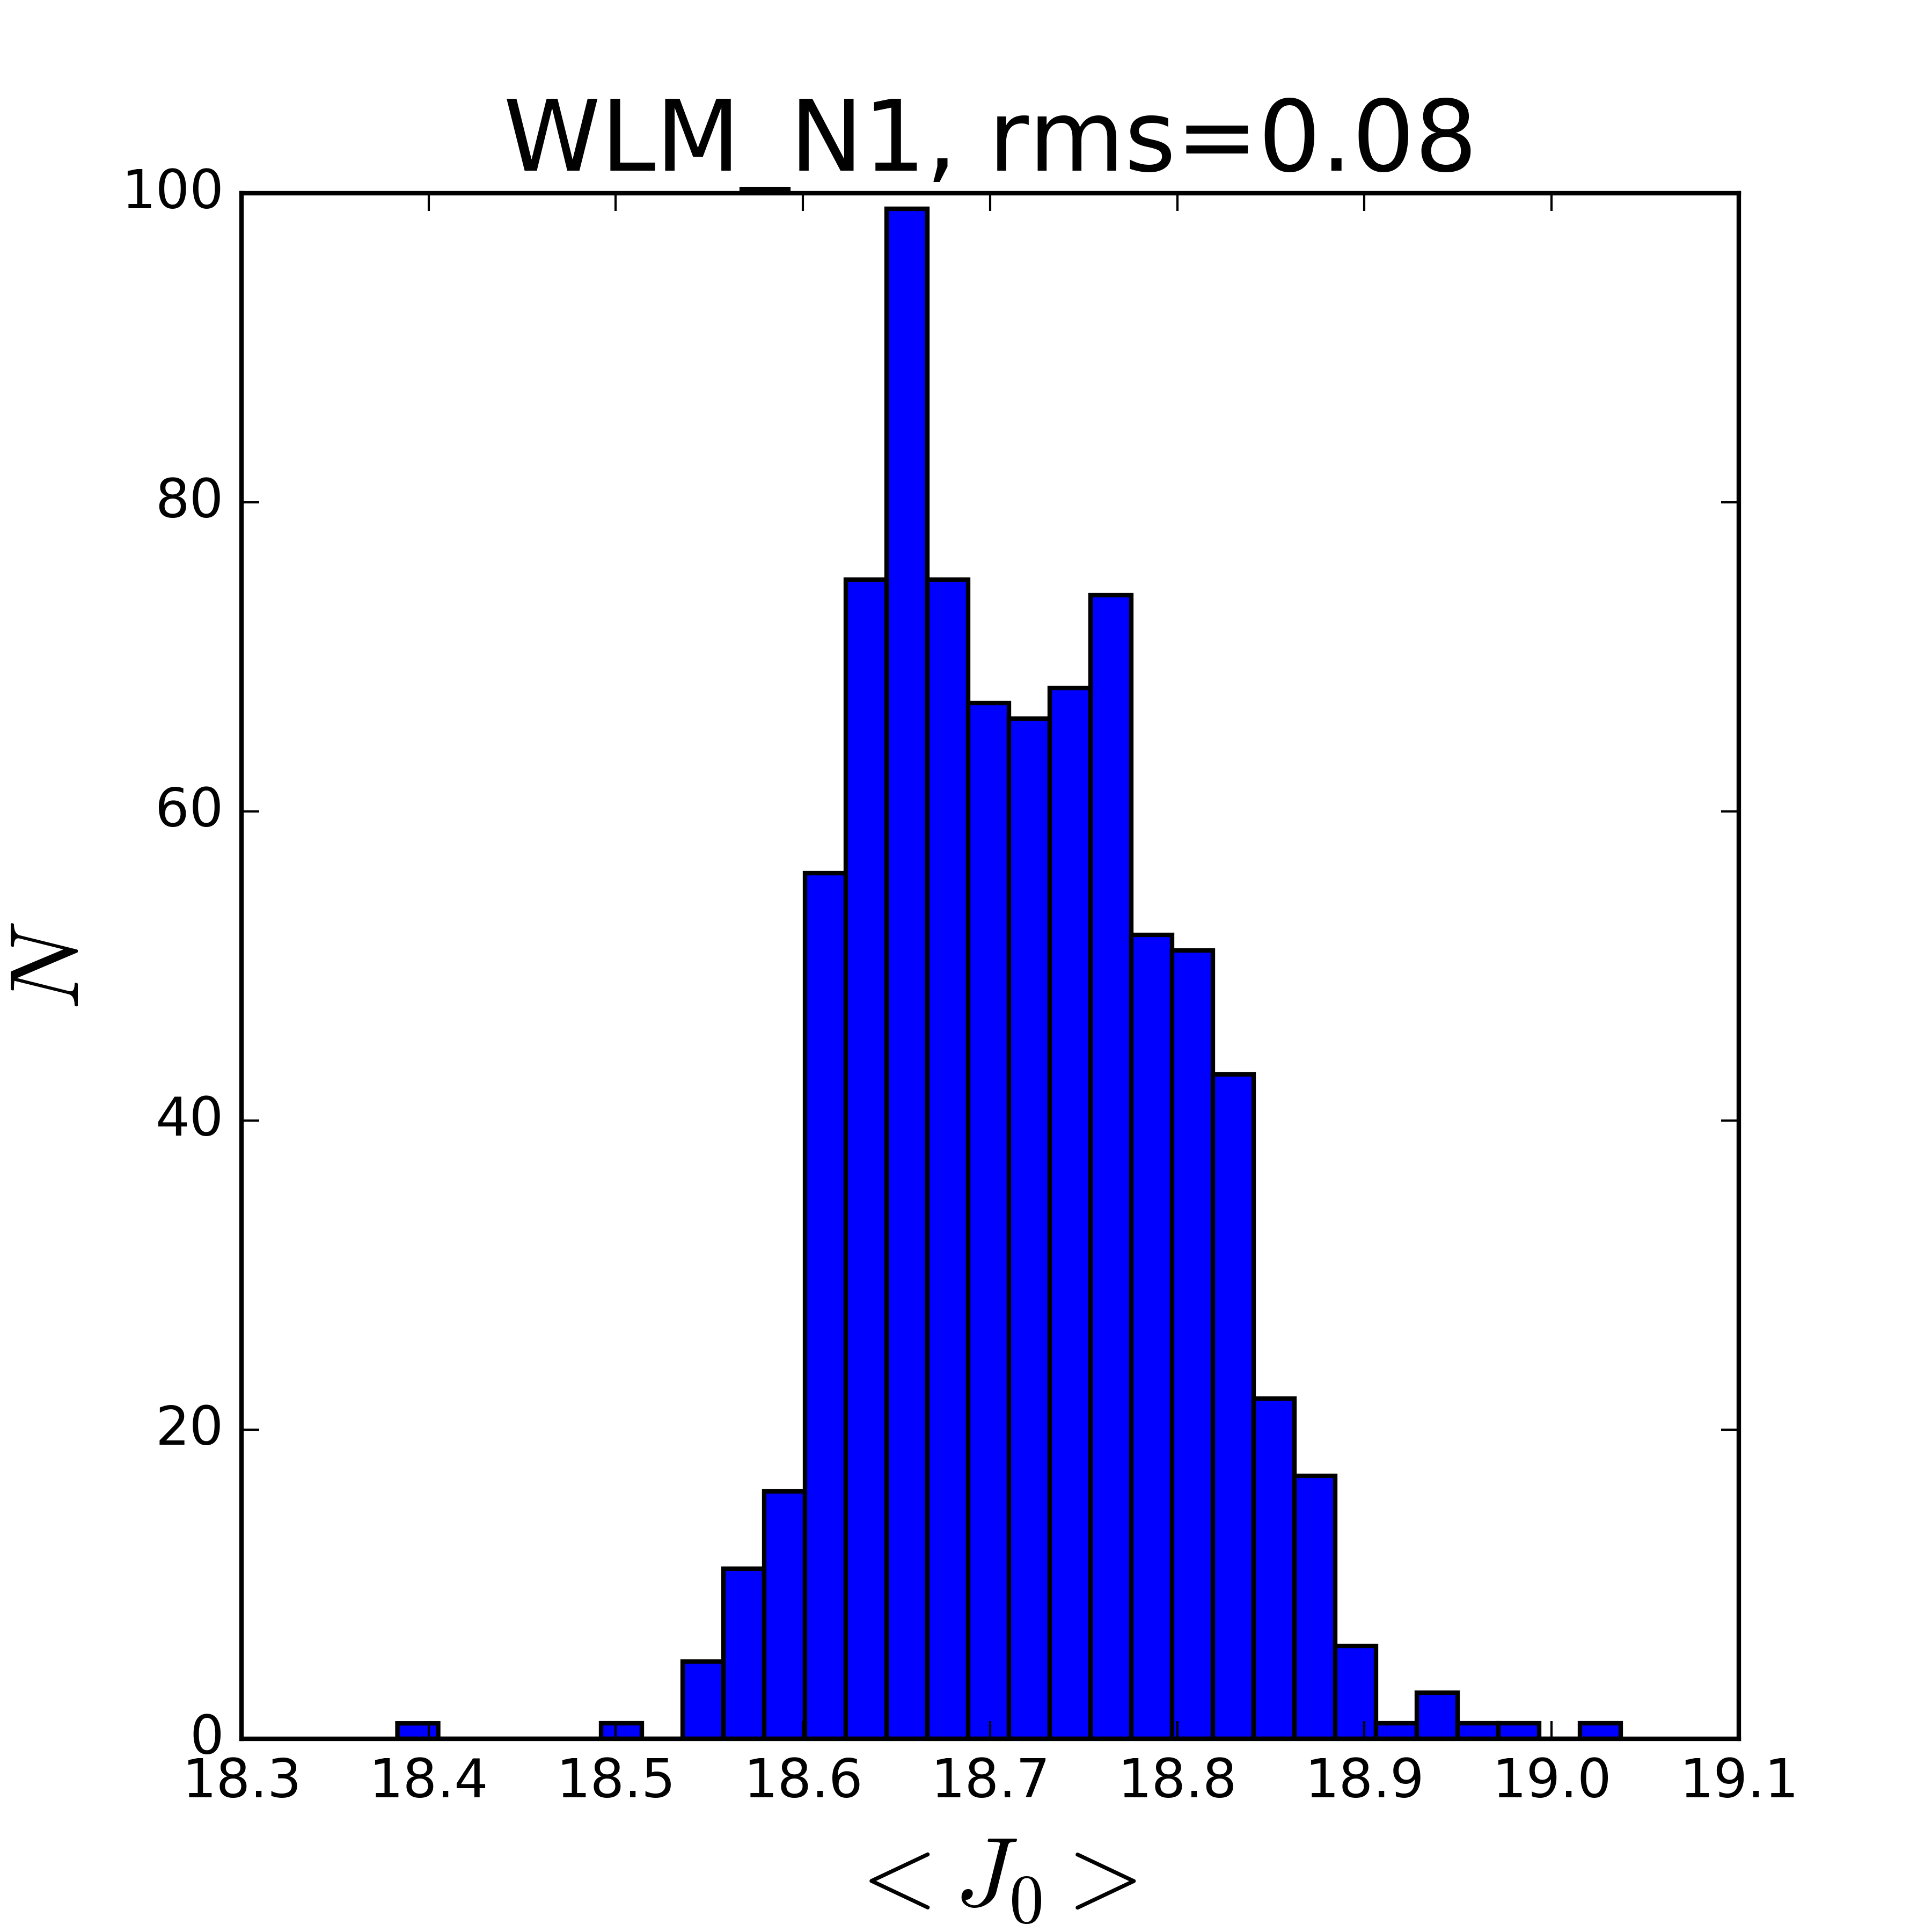
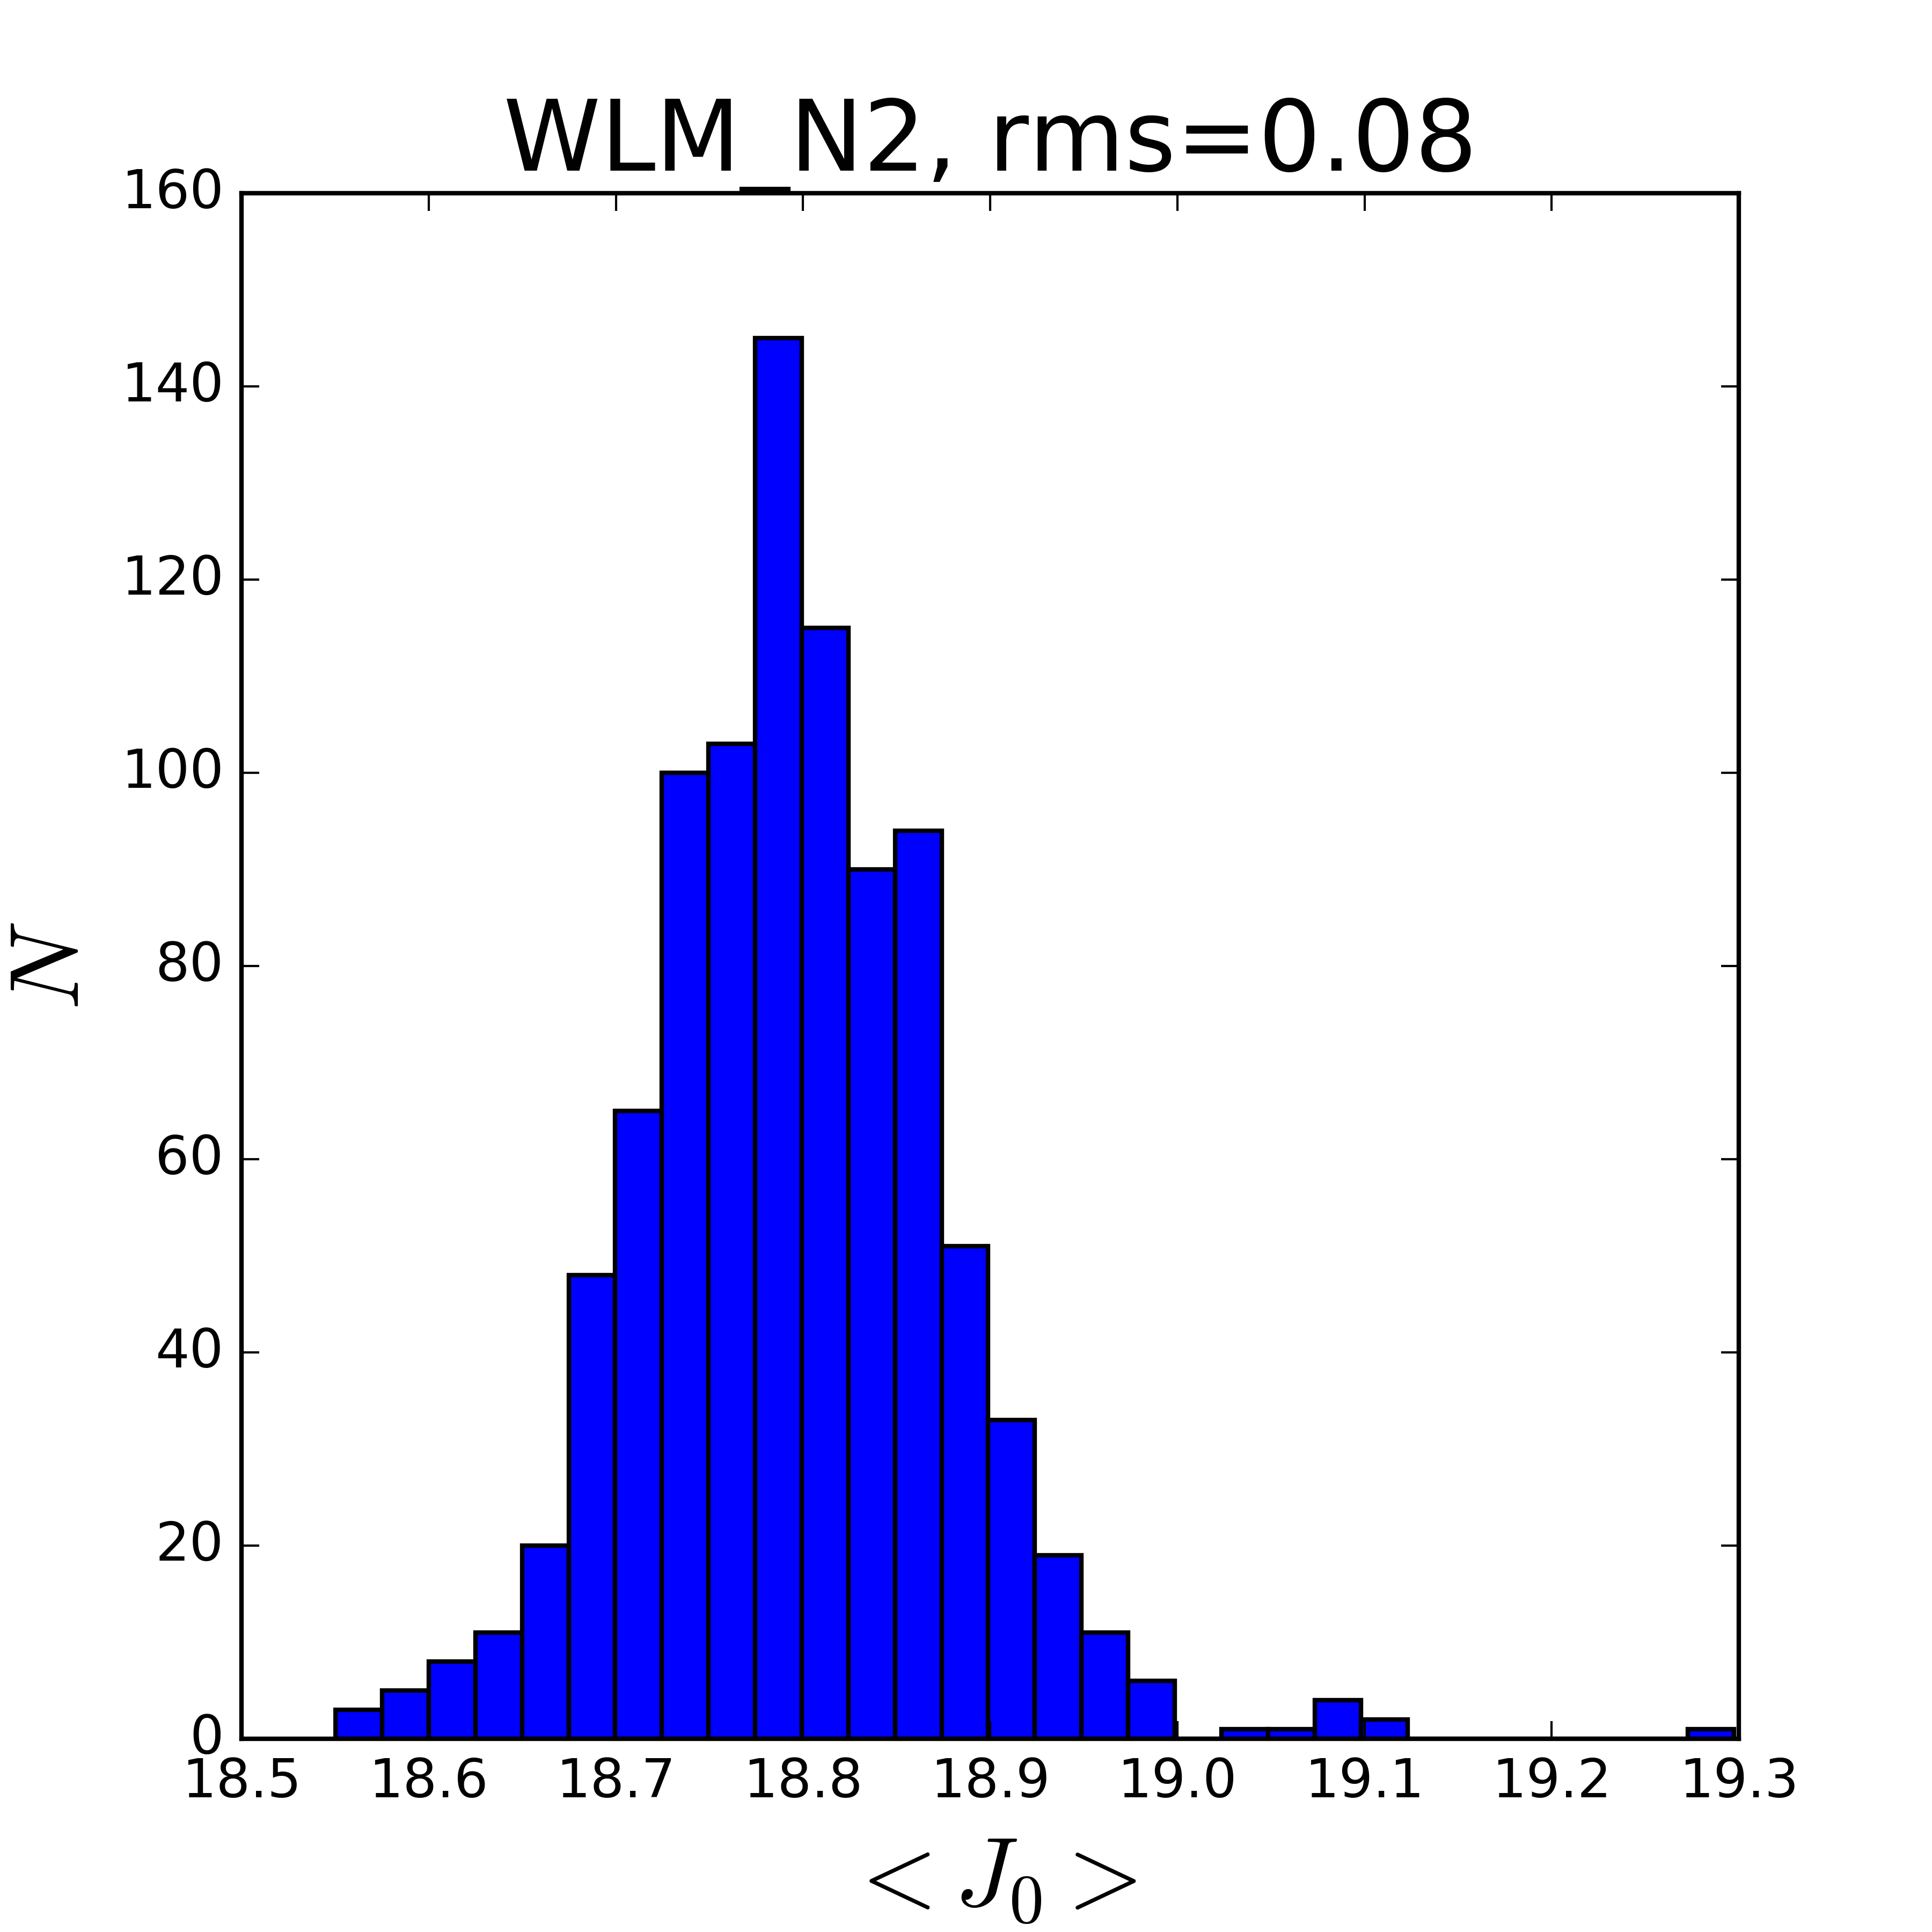
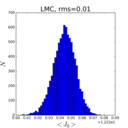
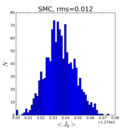
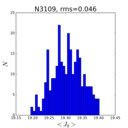
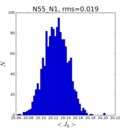
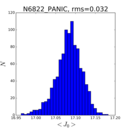
Simulations of possible results using bootstrapping
Statistical uncertainties of determinations of < J0 > estimated as rms of outcomes resulting from bootstrapping
| LMC |
SMC |
N3109 |
N247 |
N55
1st night |
N55
2nd night |
N6822
PANIC |
N6822
SOFI |
N7793 |
M33 |
N300
1st night |
N300
2nd night |
WLM
1st night |
WLM
2nd night |
 |
 |
 |
 |
 |
 |
 |
 |
 |
 |
 |
 |
 |
 |
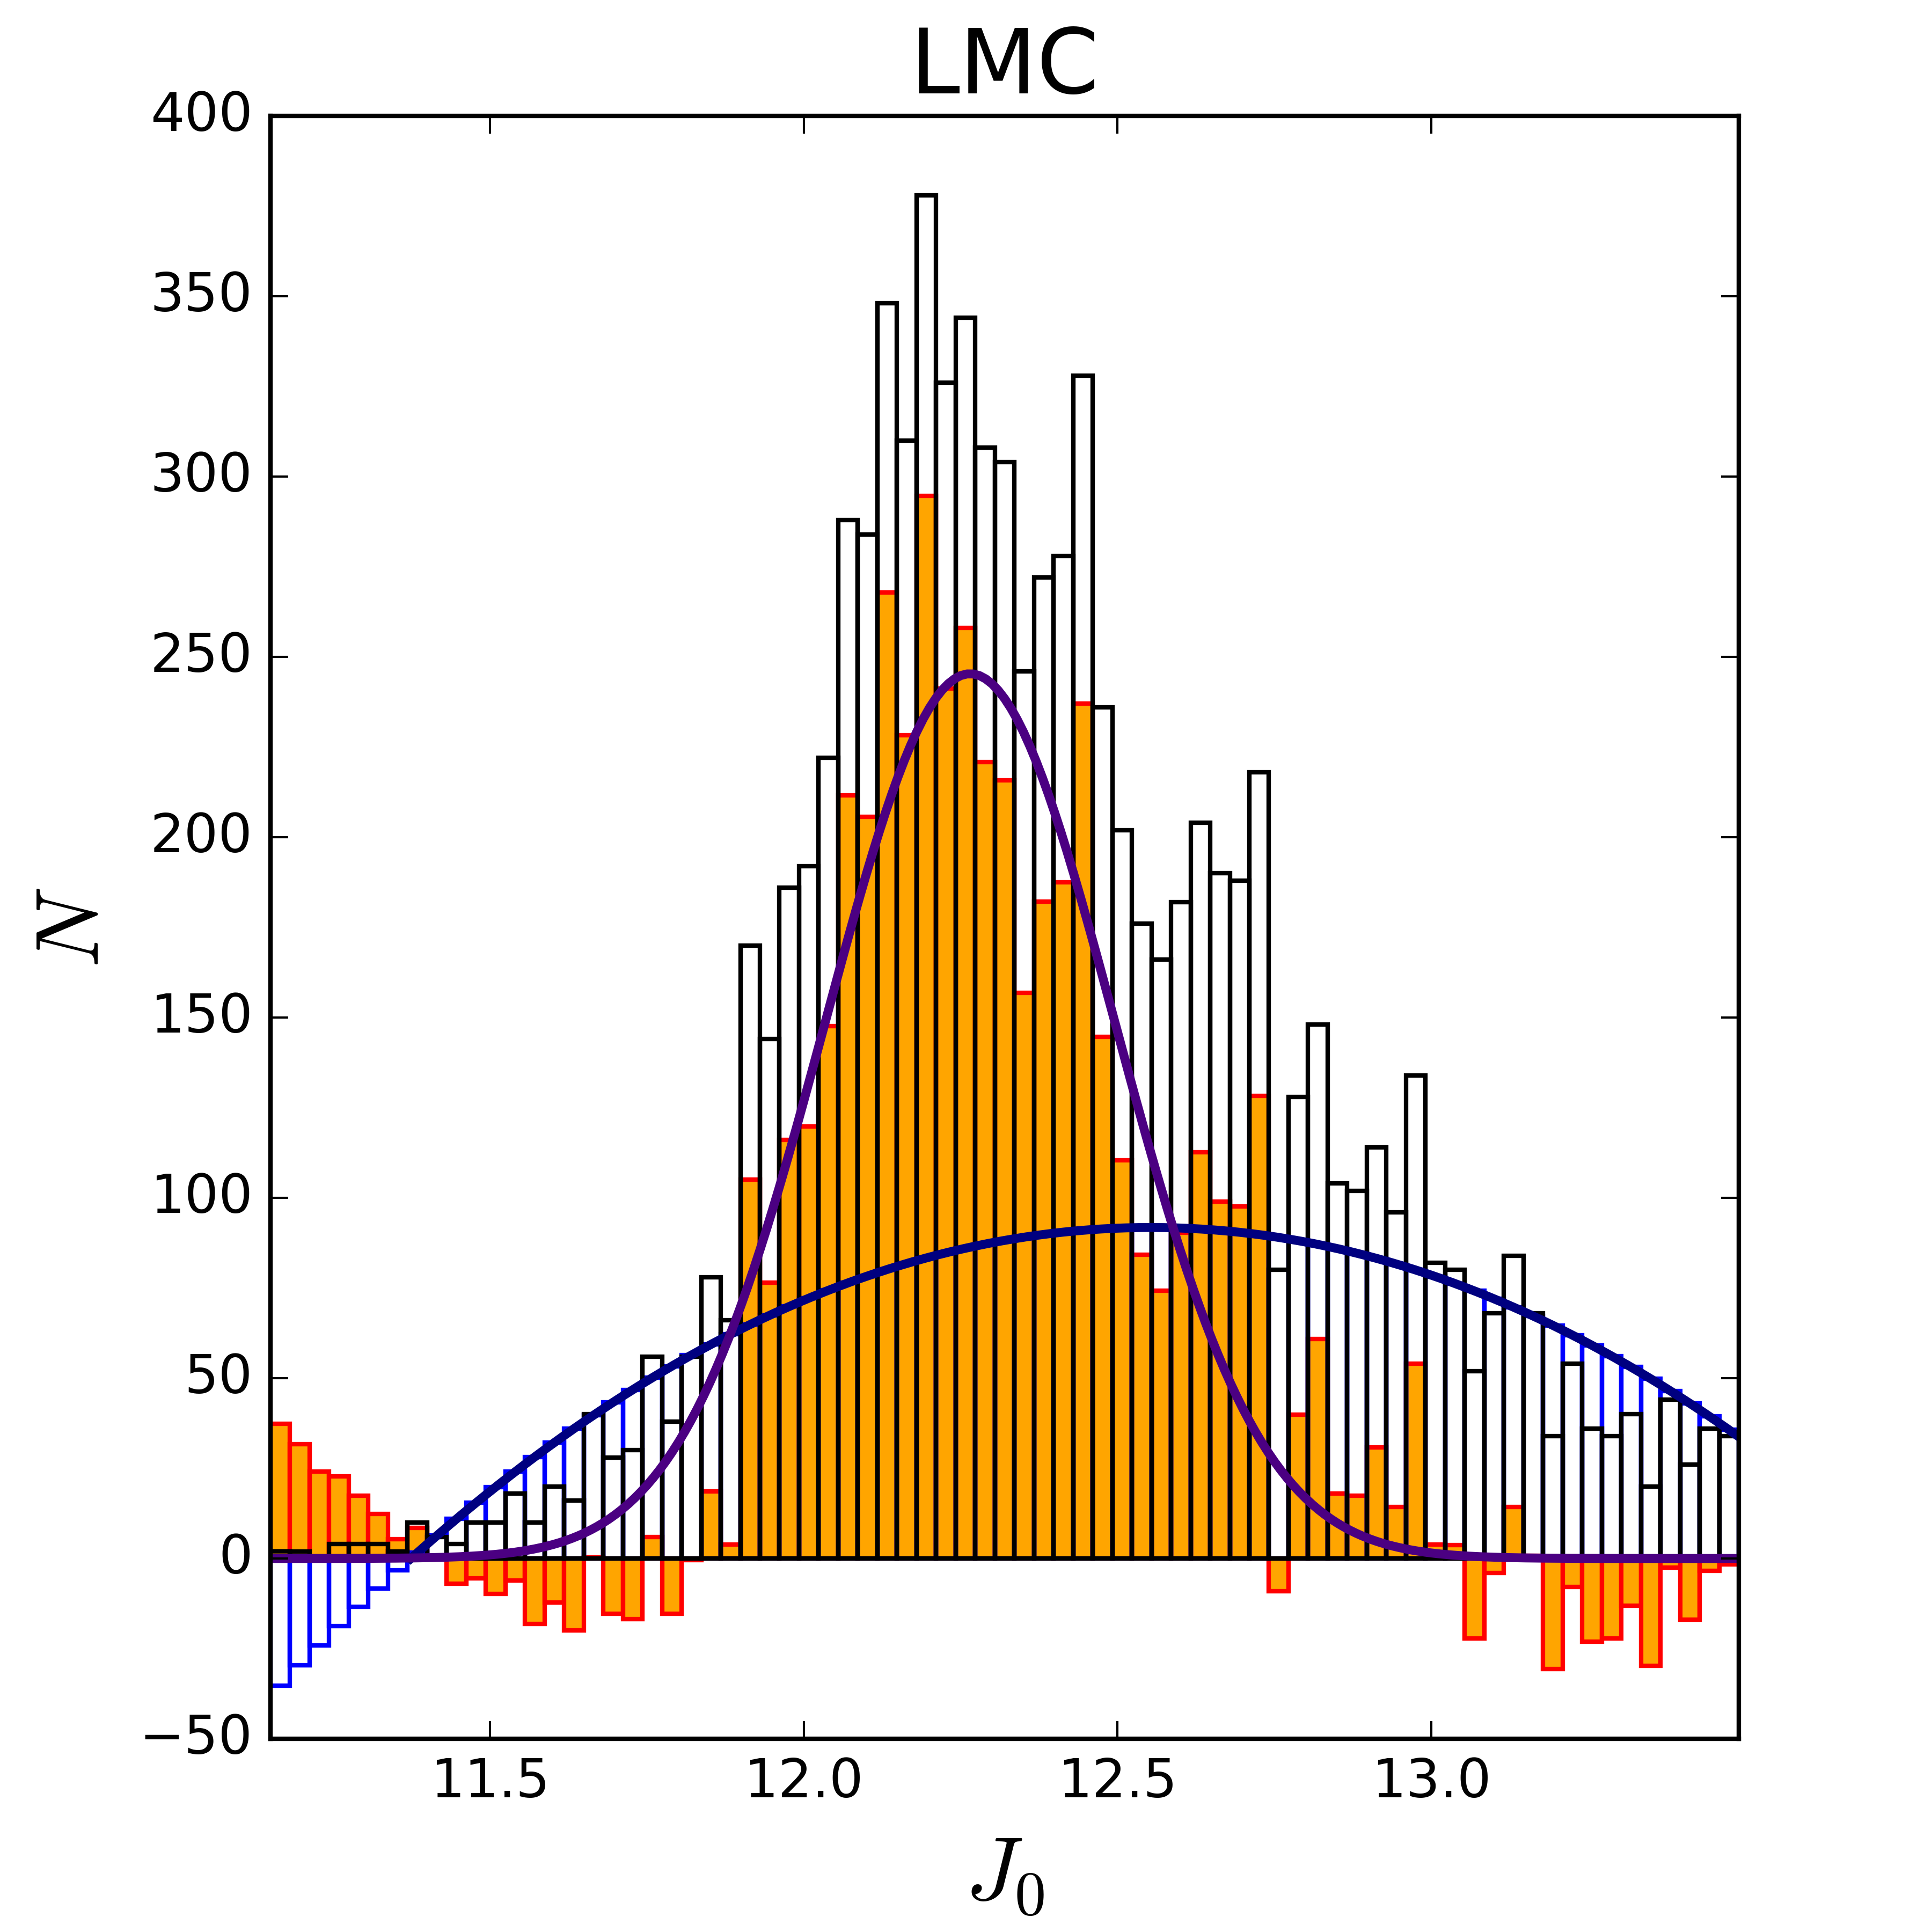
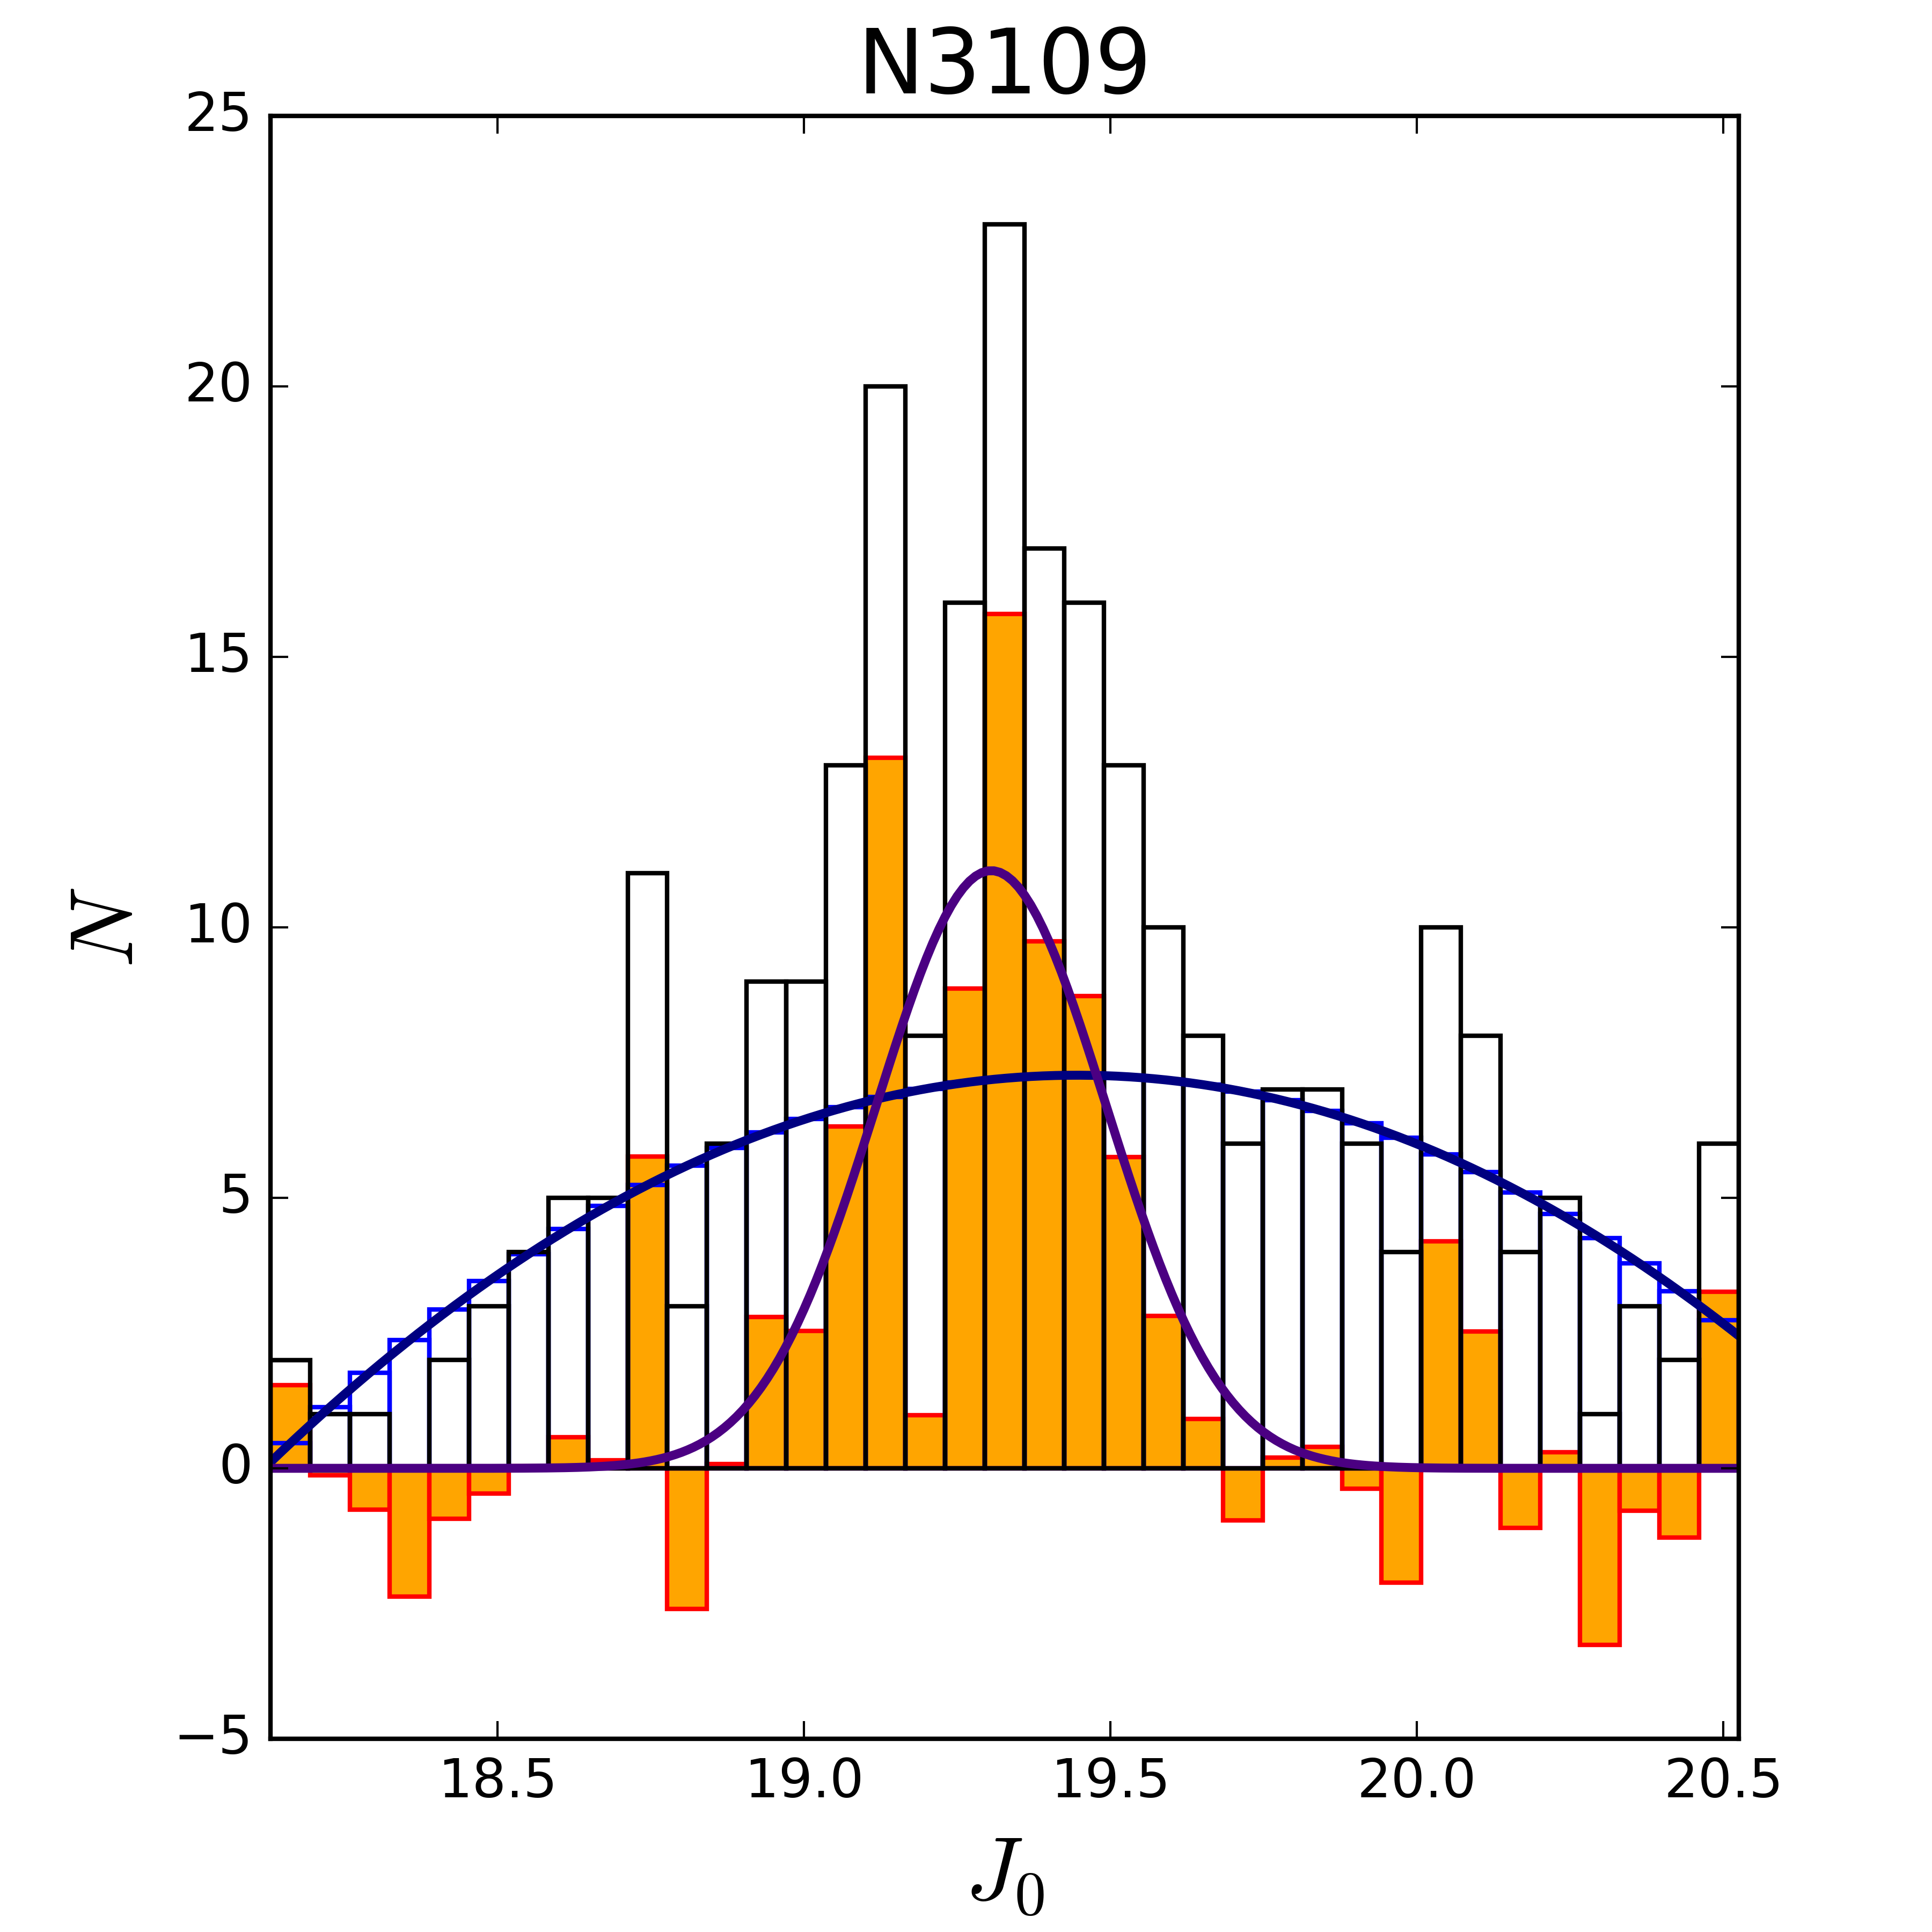
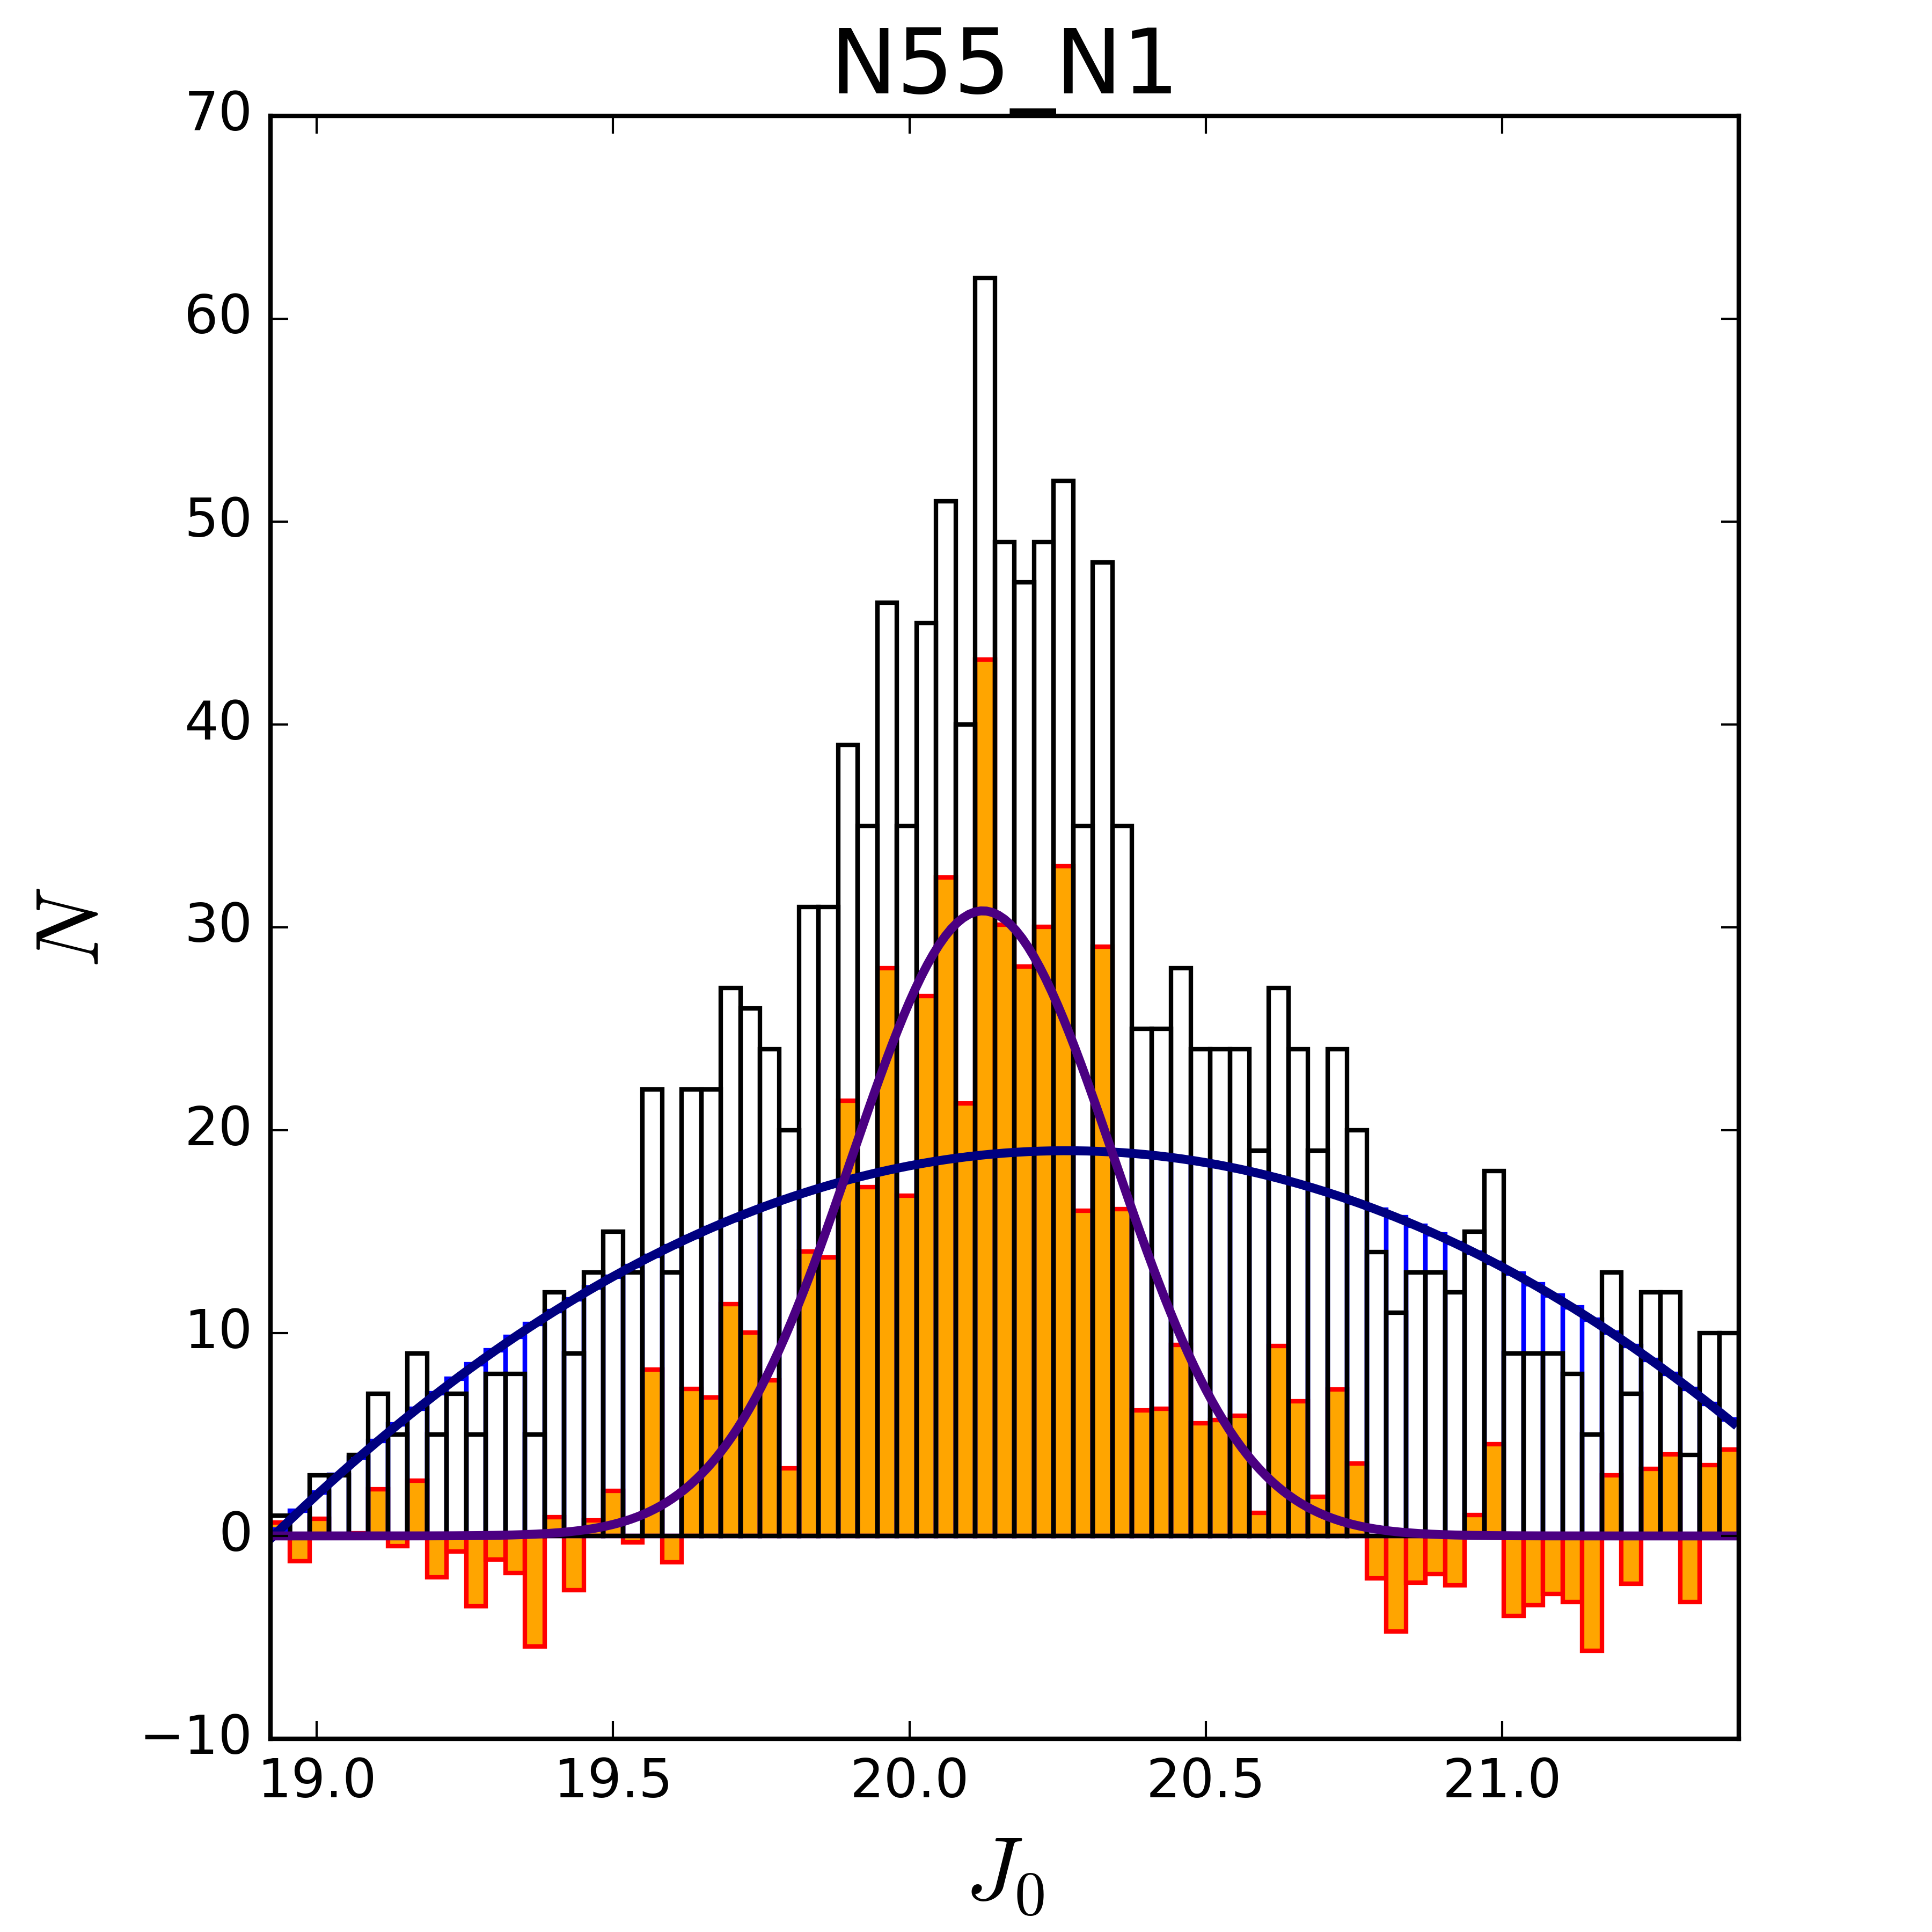
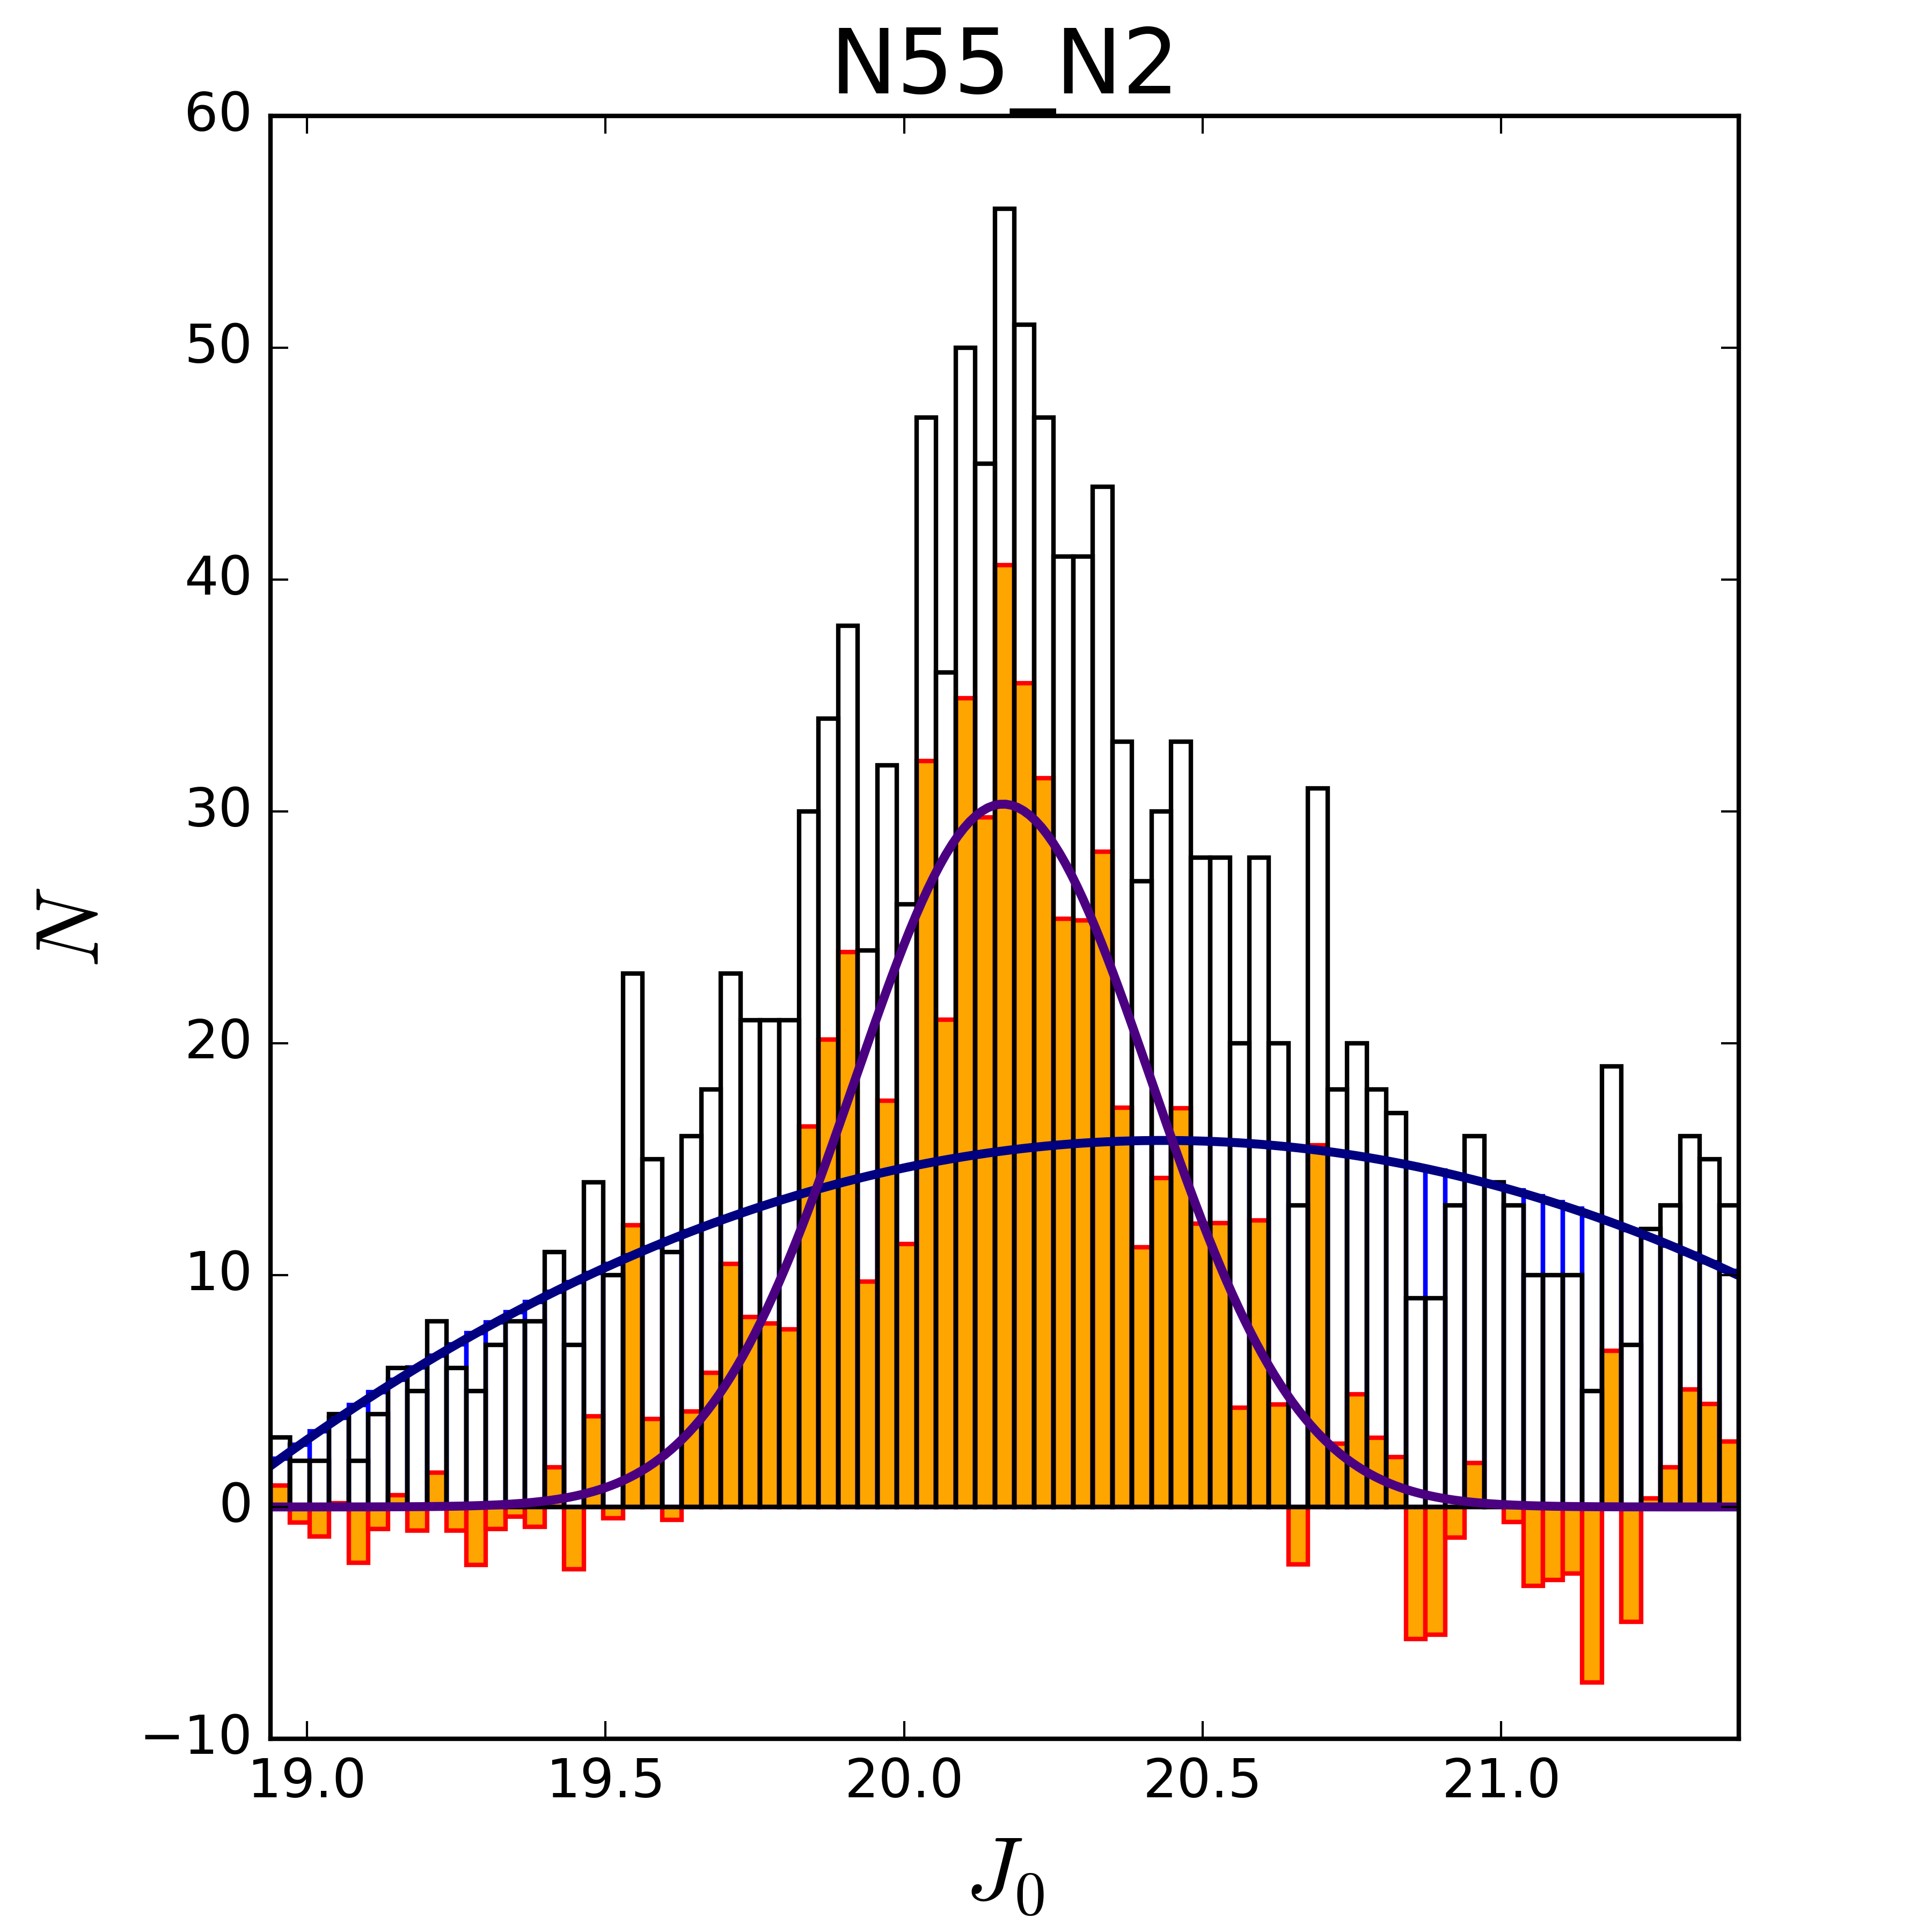
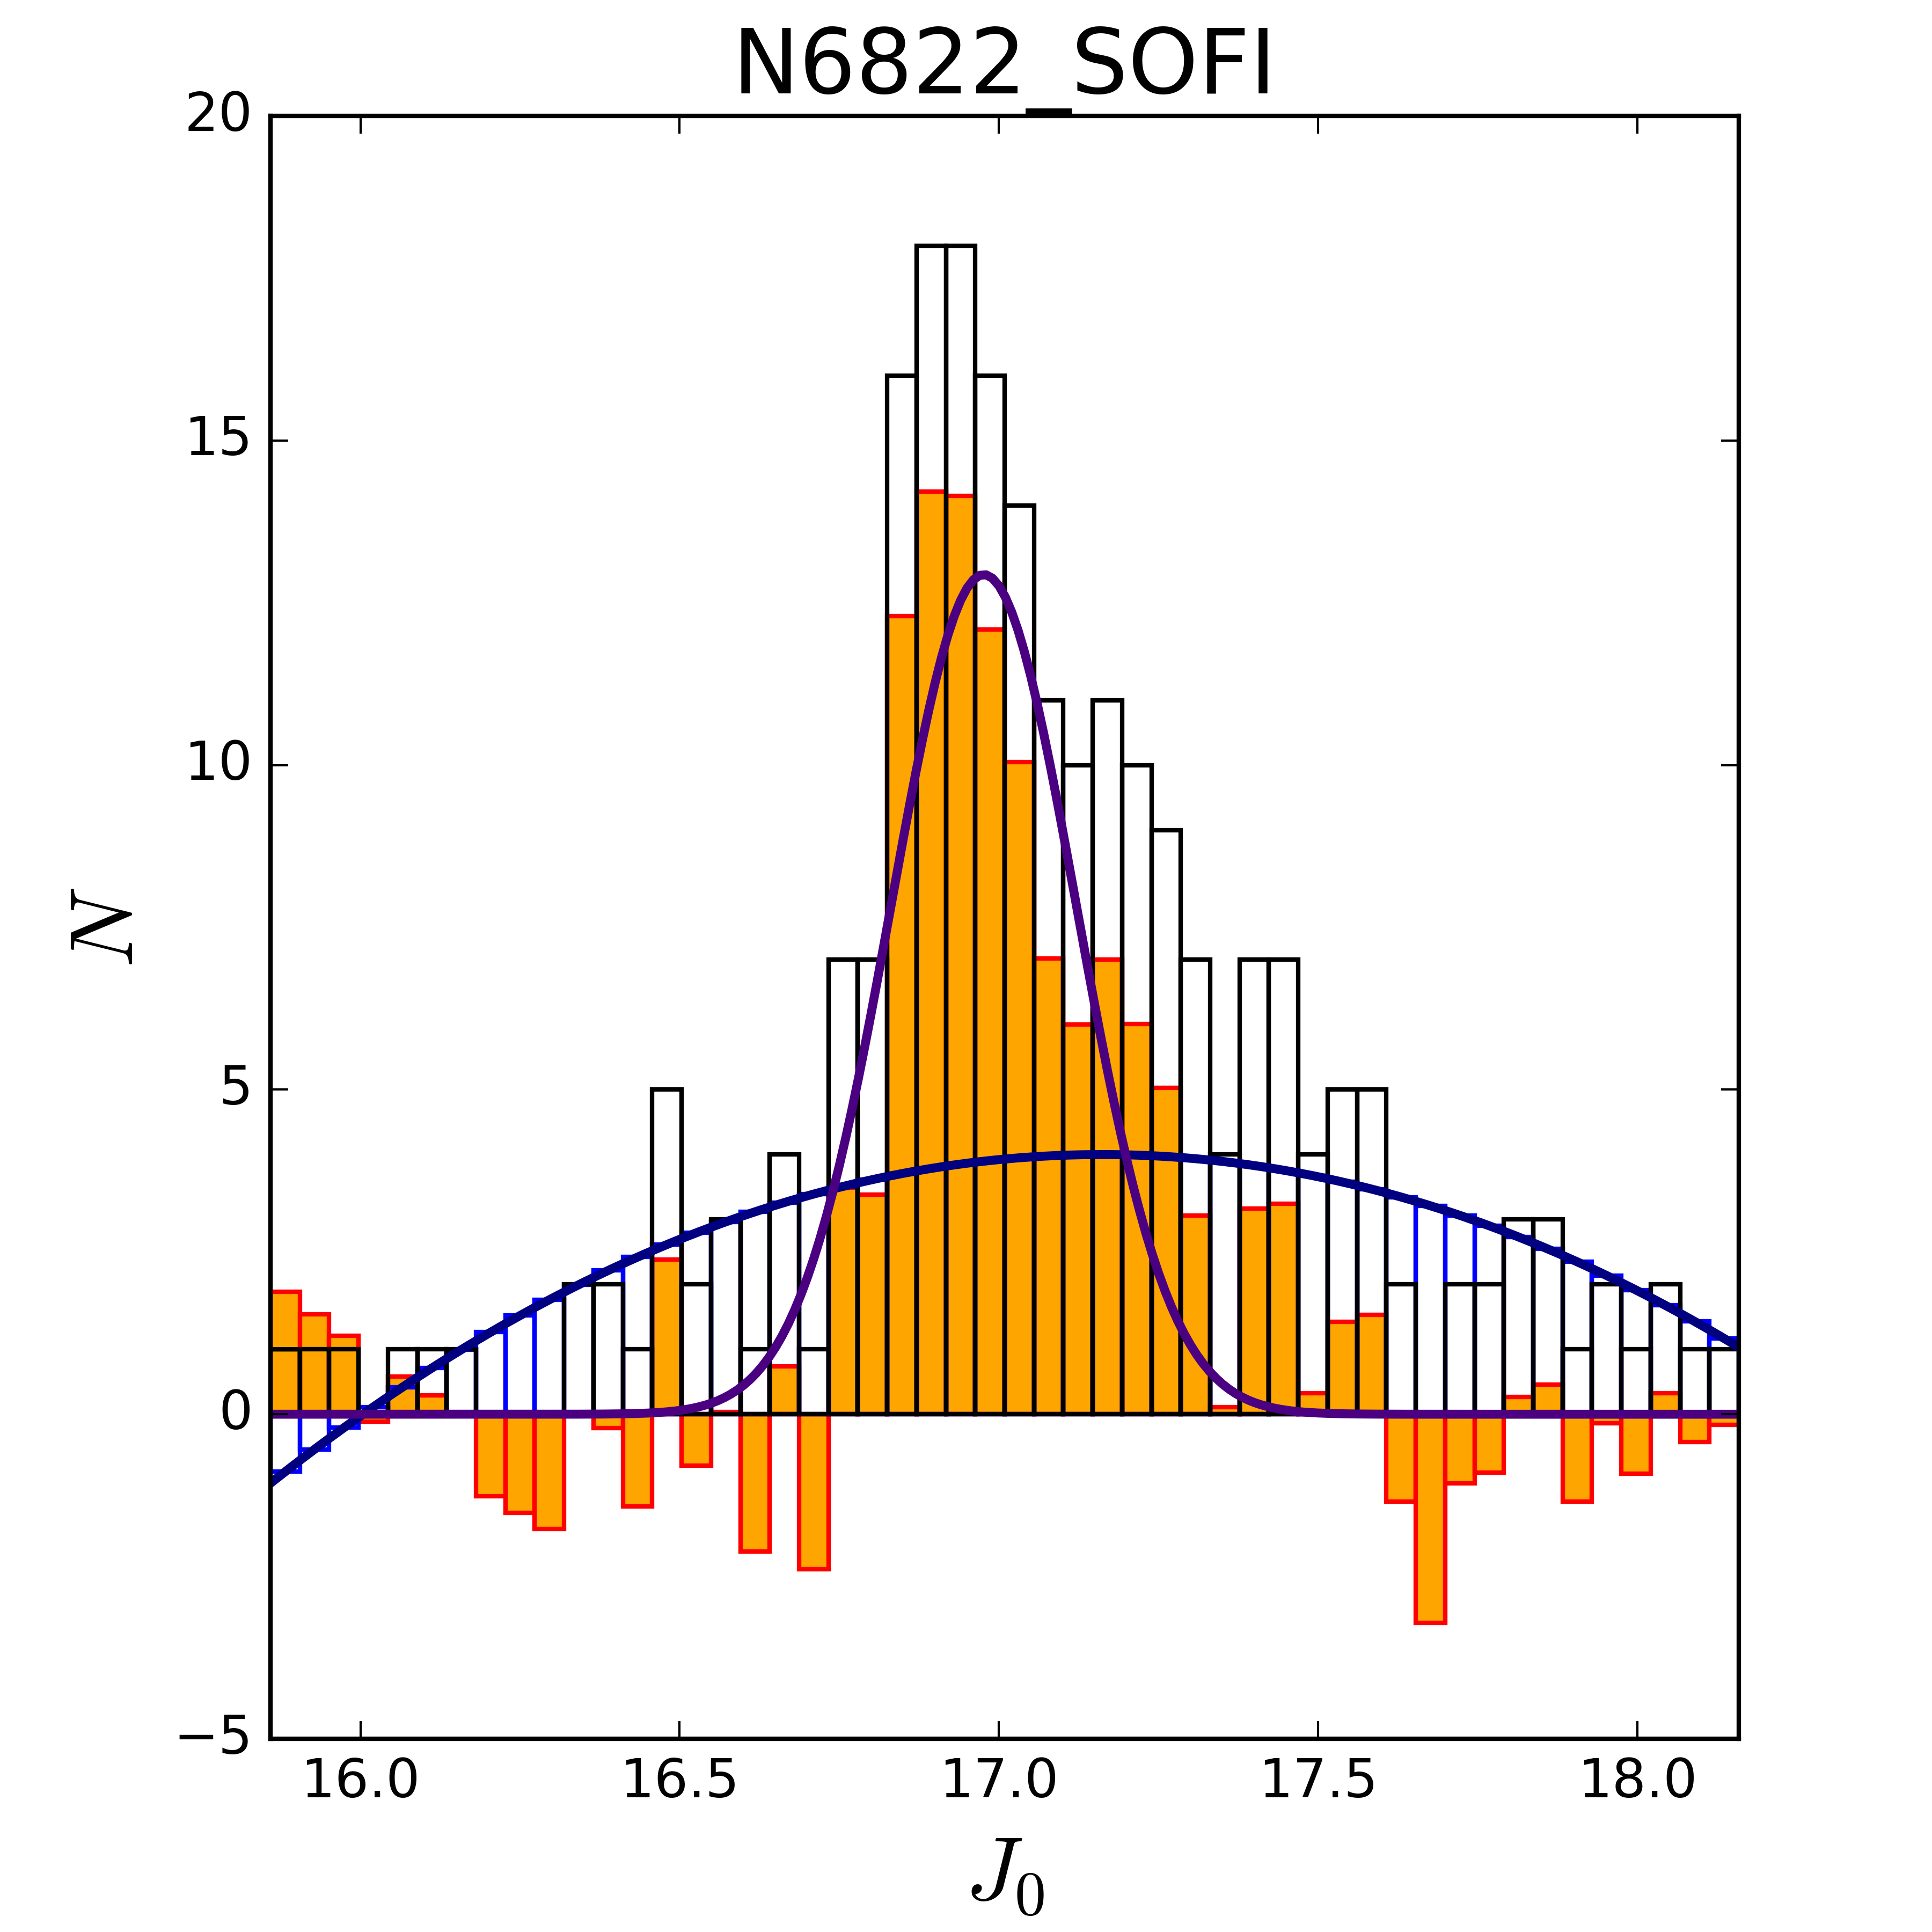
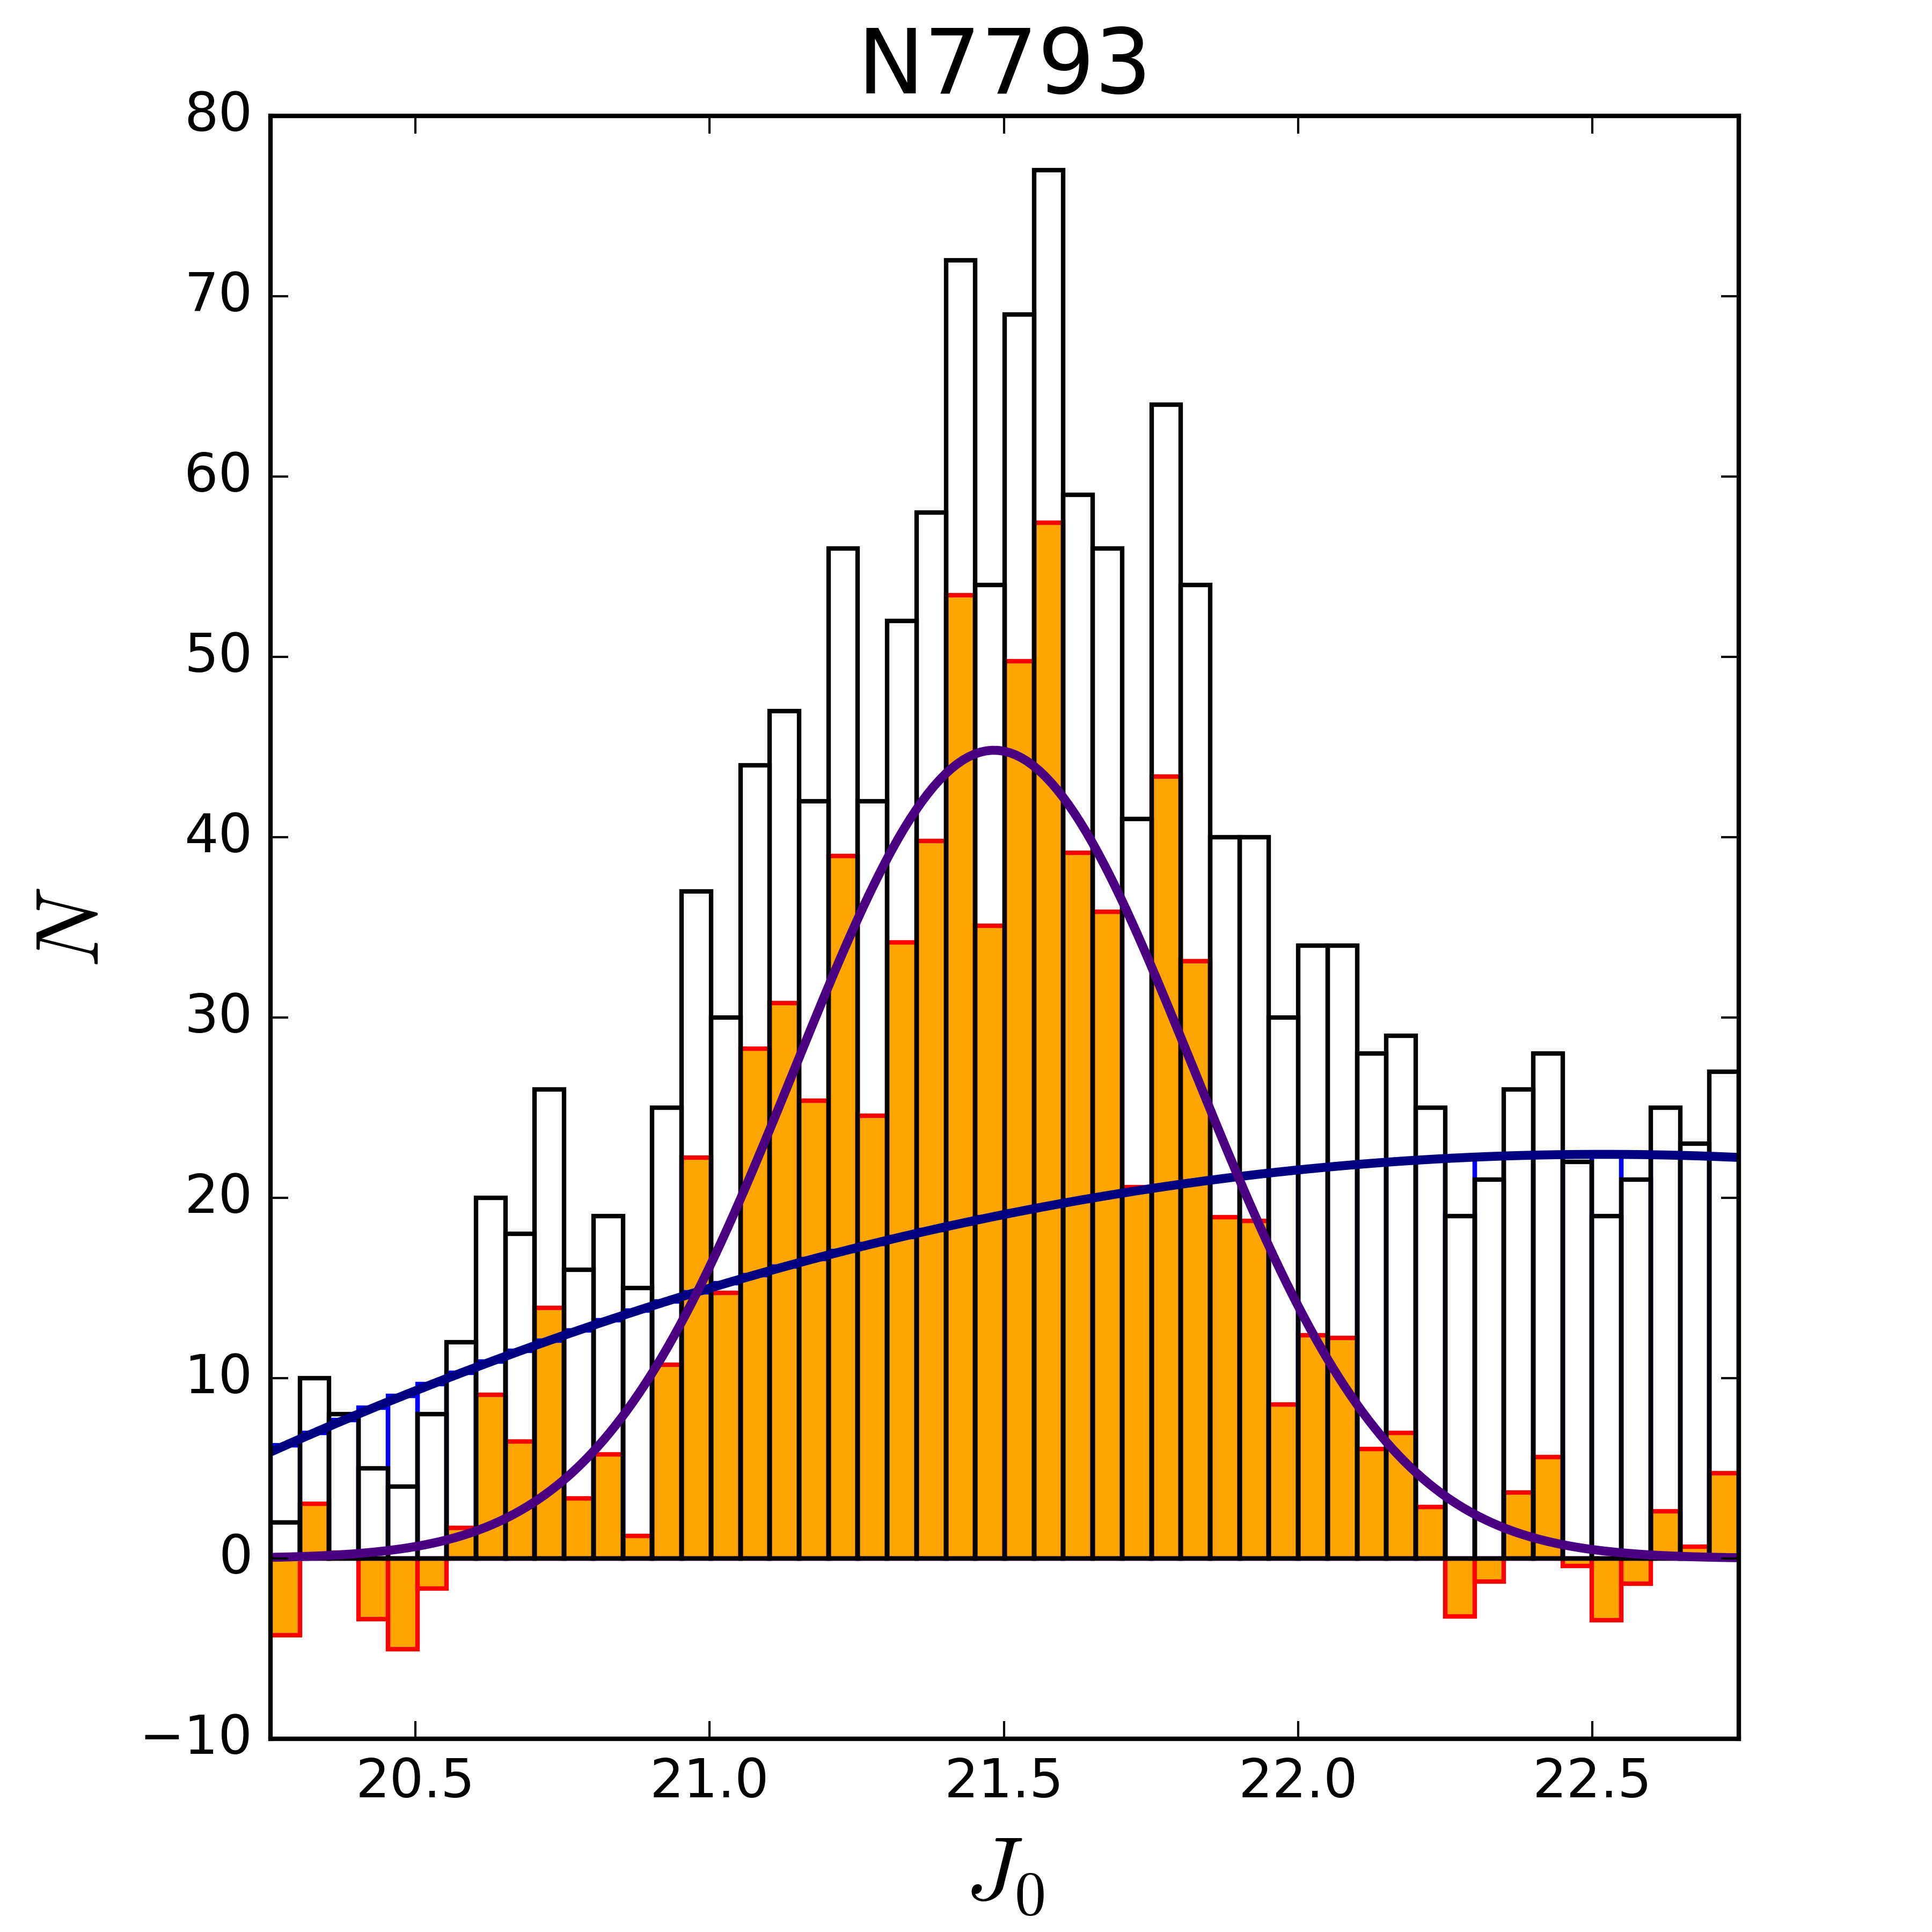
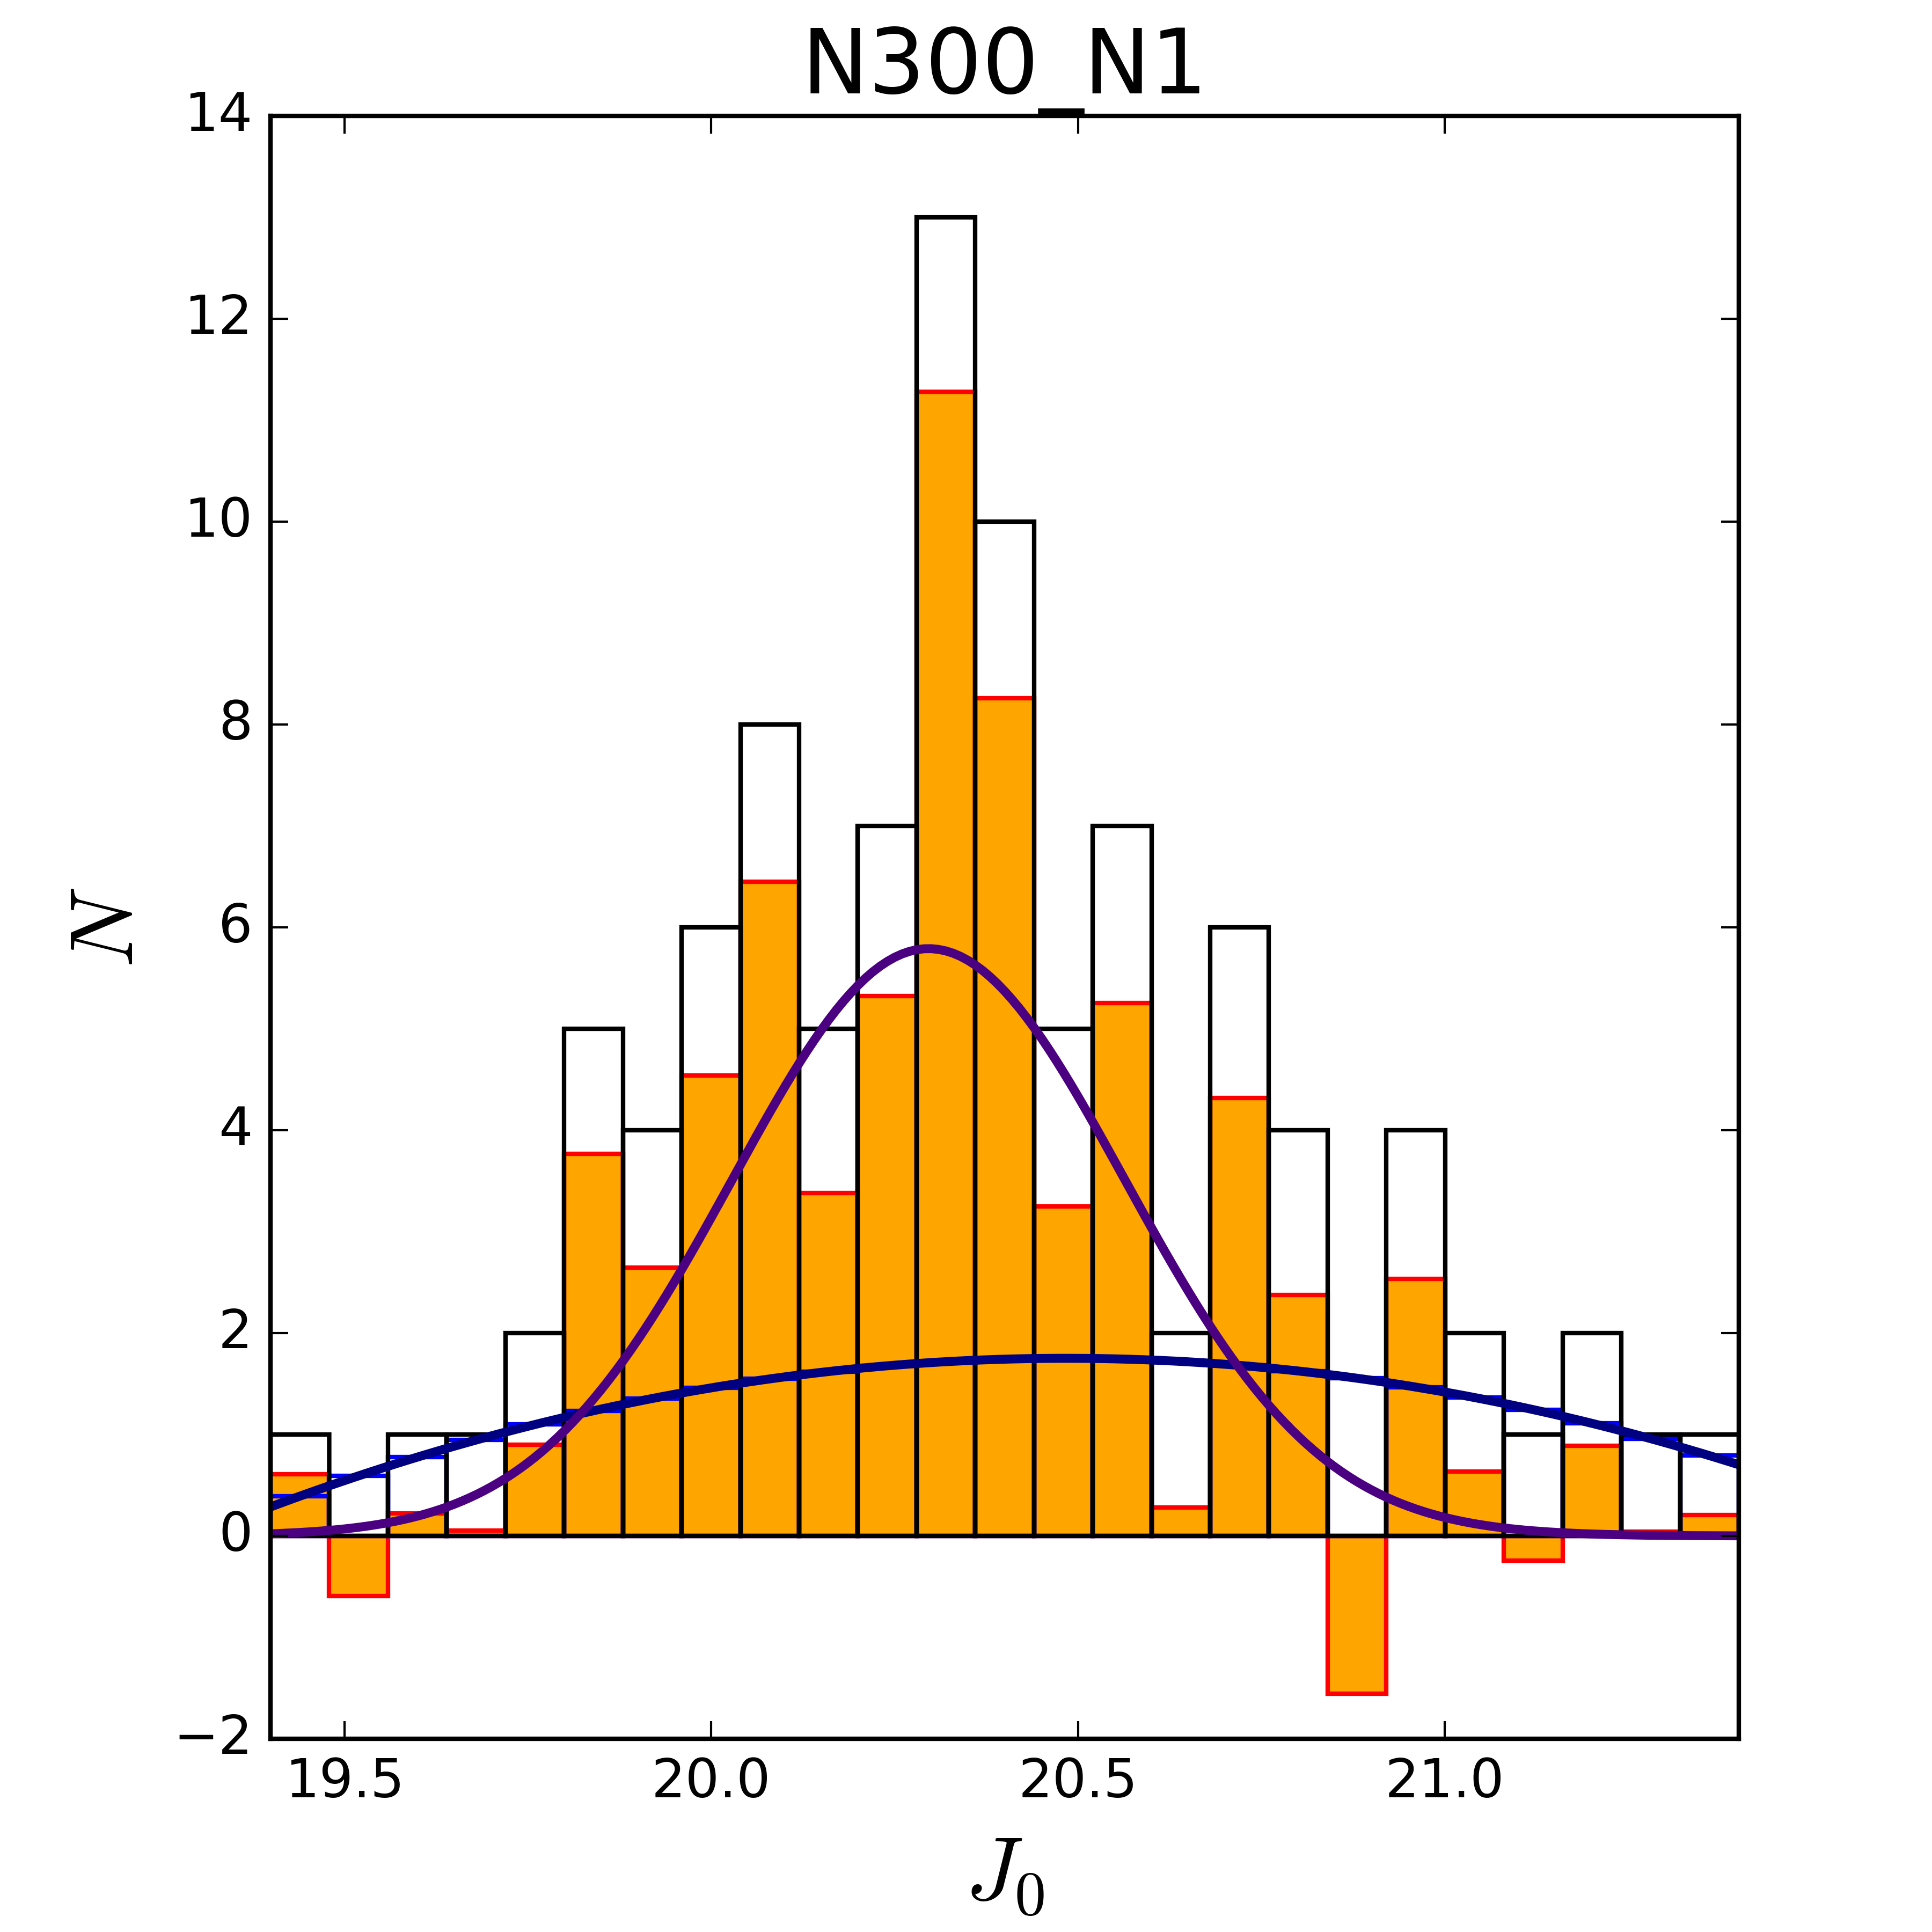
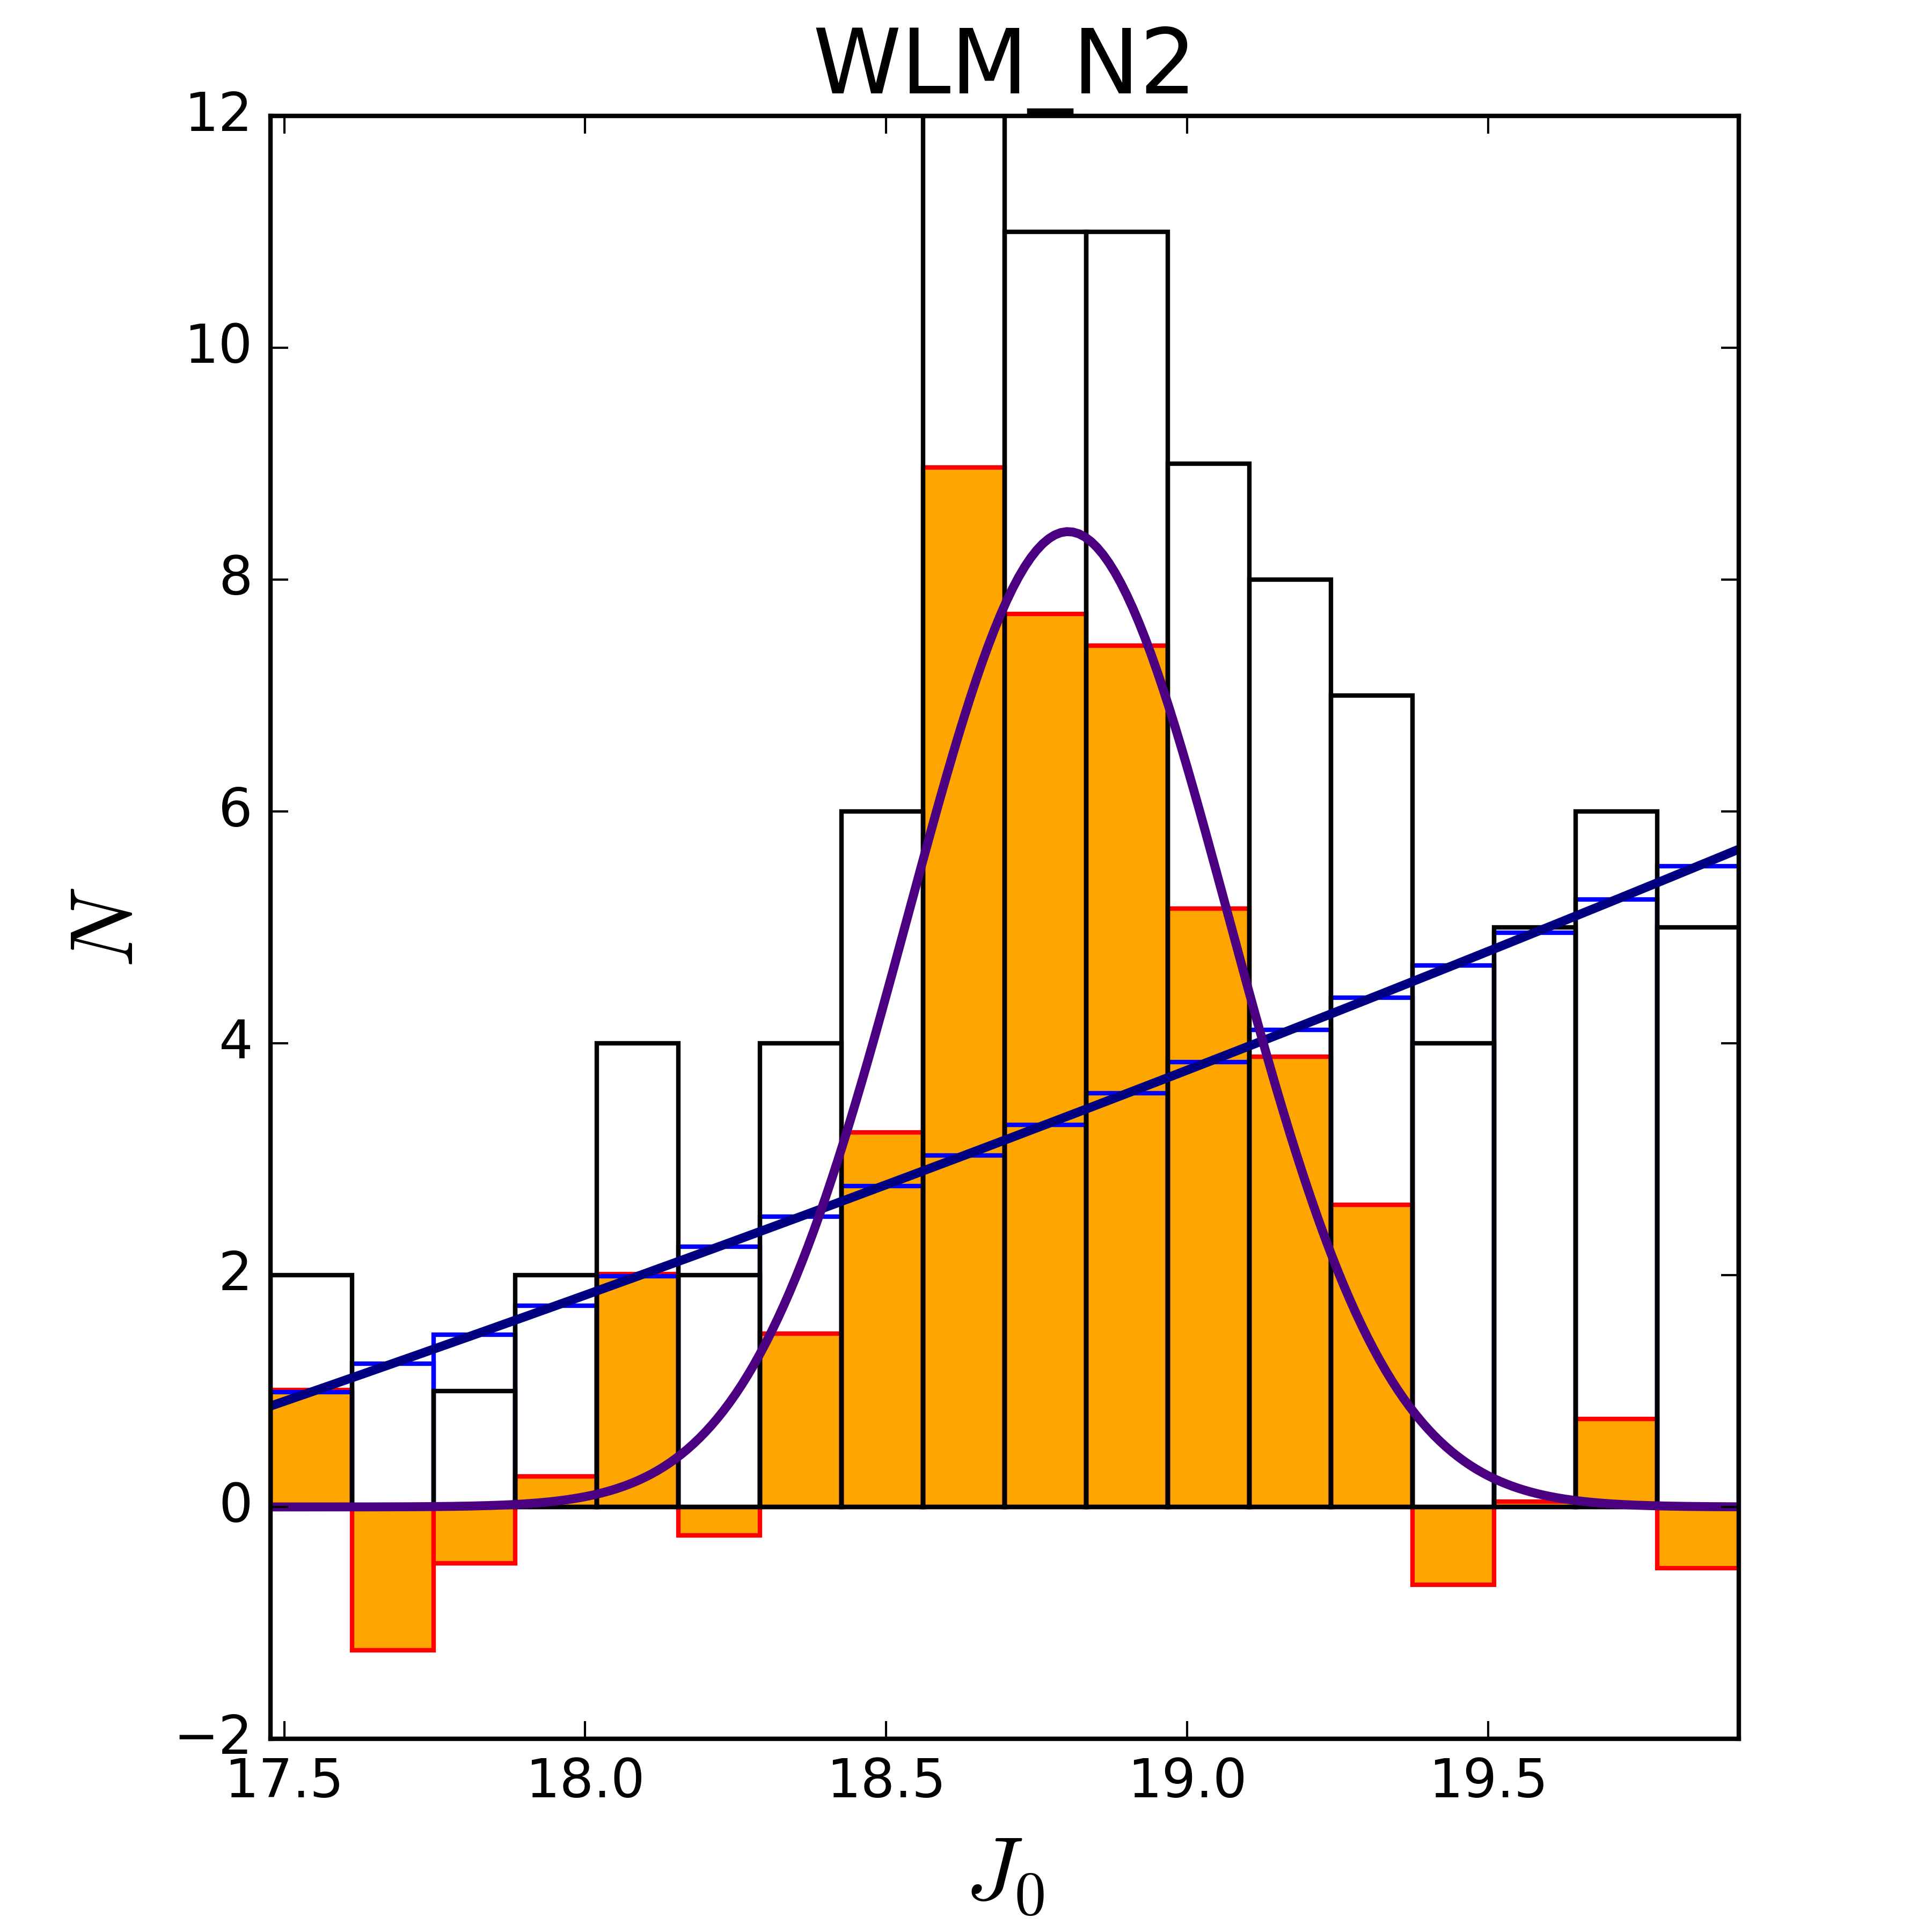
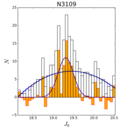
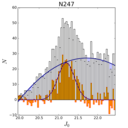
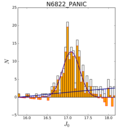
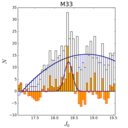
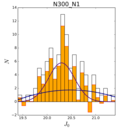
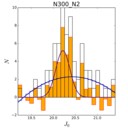
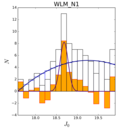
Components of fitted functions (Gaussian and quadratic)
Residual distributions (in orange) resulting from the subtraction of the quadratic component of the fit from the apparent distribution of luminosities of stars from selection boxes for all studied galaxies. The original distributions of luminosities are shown using black, empty bins in the background.
| LMC |
SMC |
N3109 |
N247 |
N55
1st night |
N55
2nd night |
N6822
PANIC |
N6822
SOFI |
N7793 |
M33 |
N300
1st night |
N300
2nd night |
WLM
1st night |
WLM
2nd night |
 |
 |
 |
 |
 |
 |
 |
 |
 |
 |
 |
 |
 |
 |
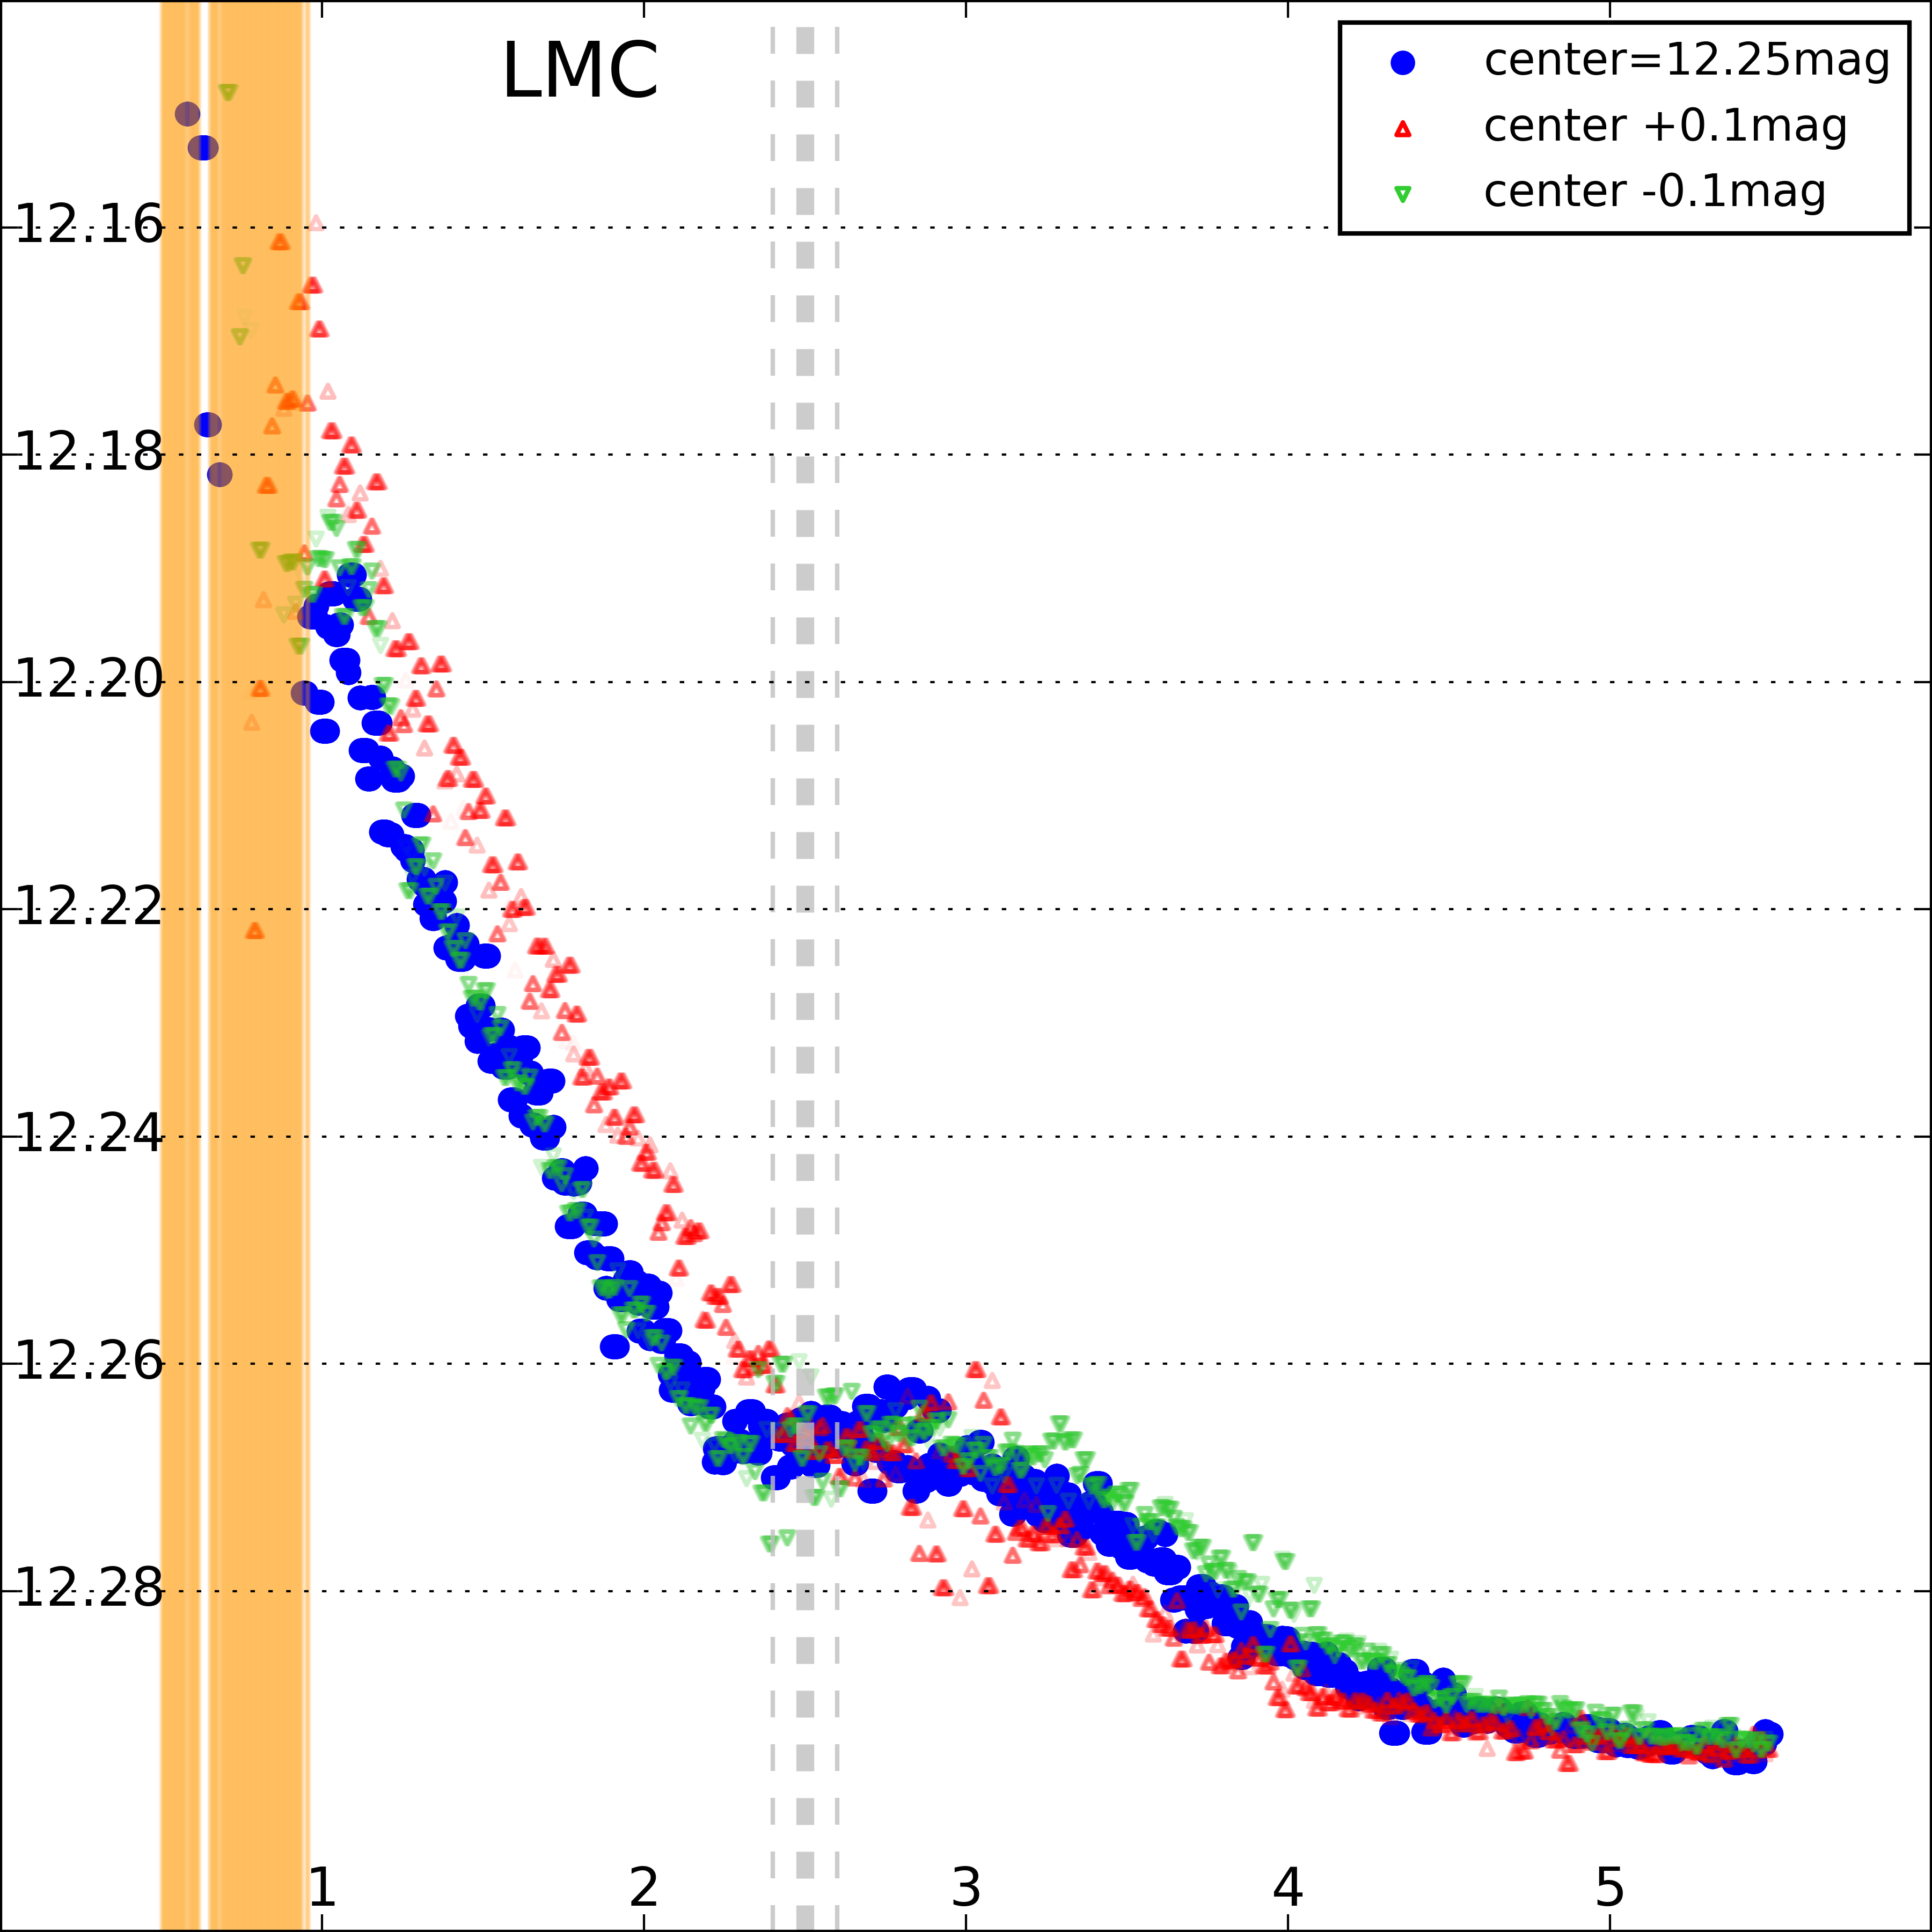
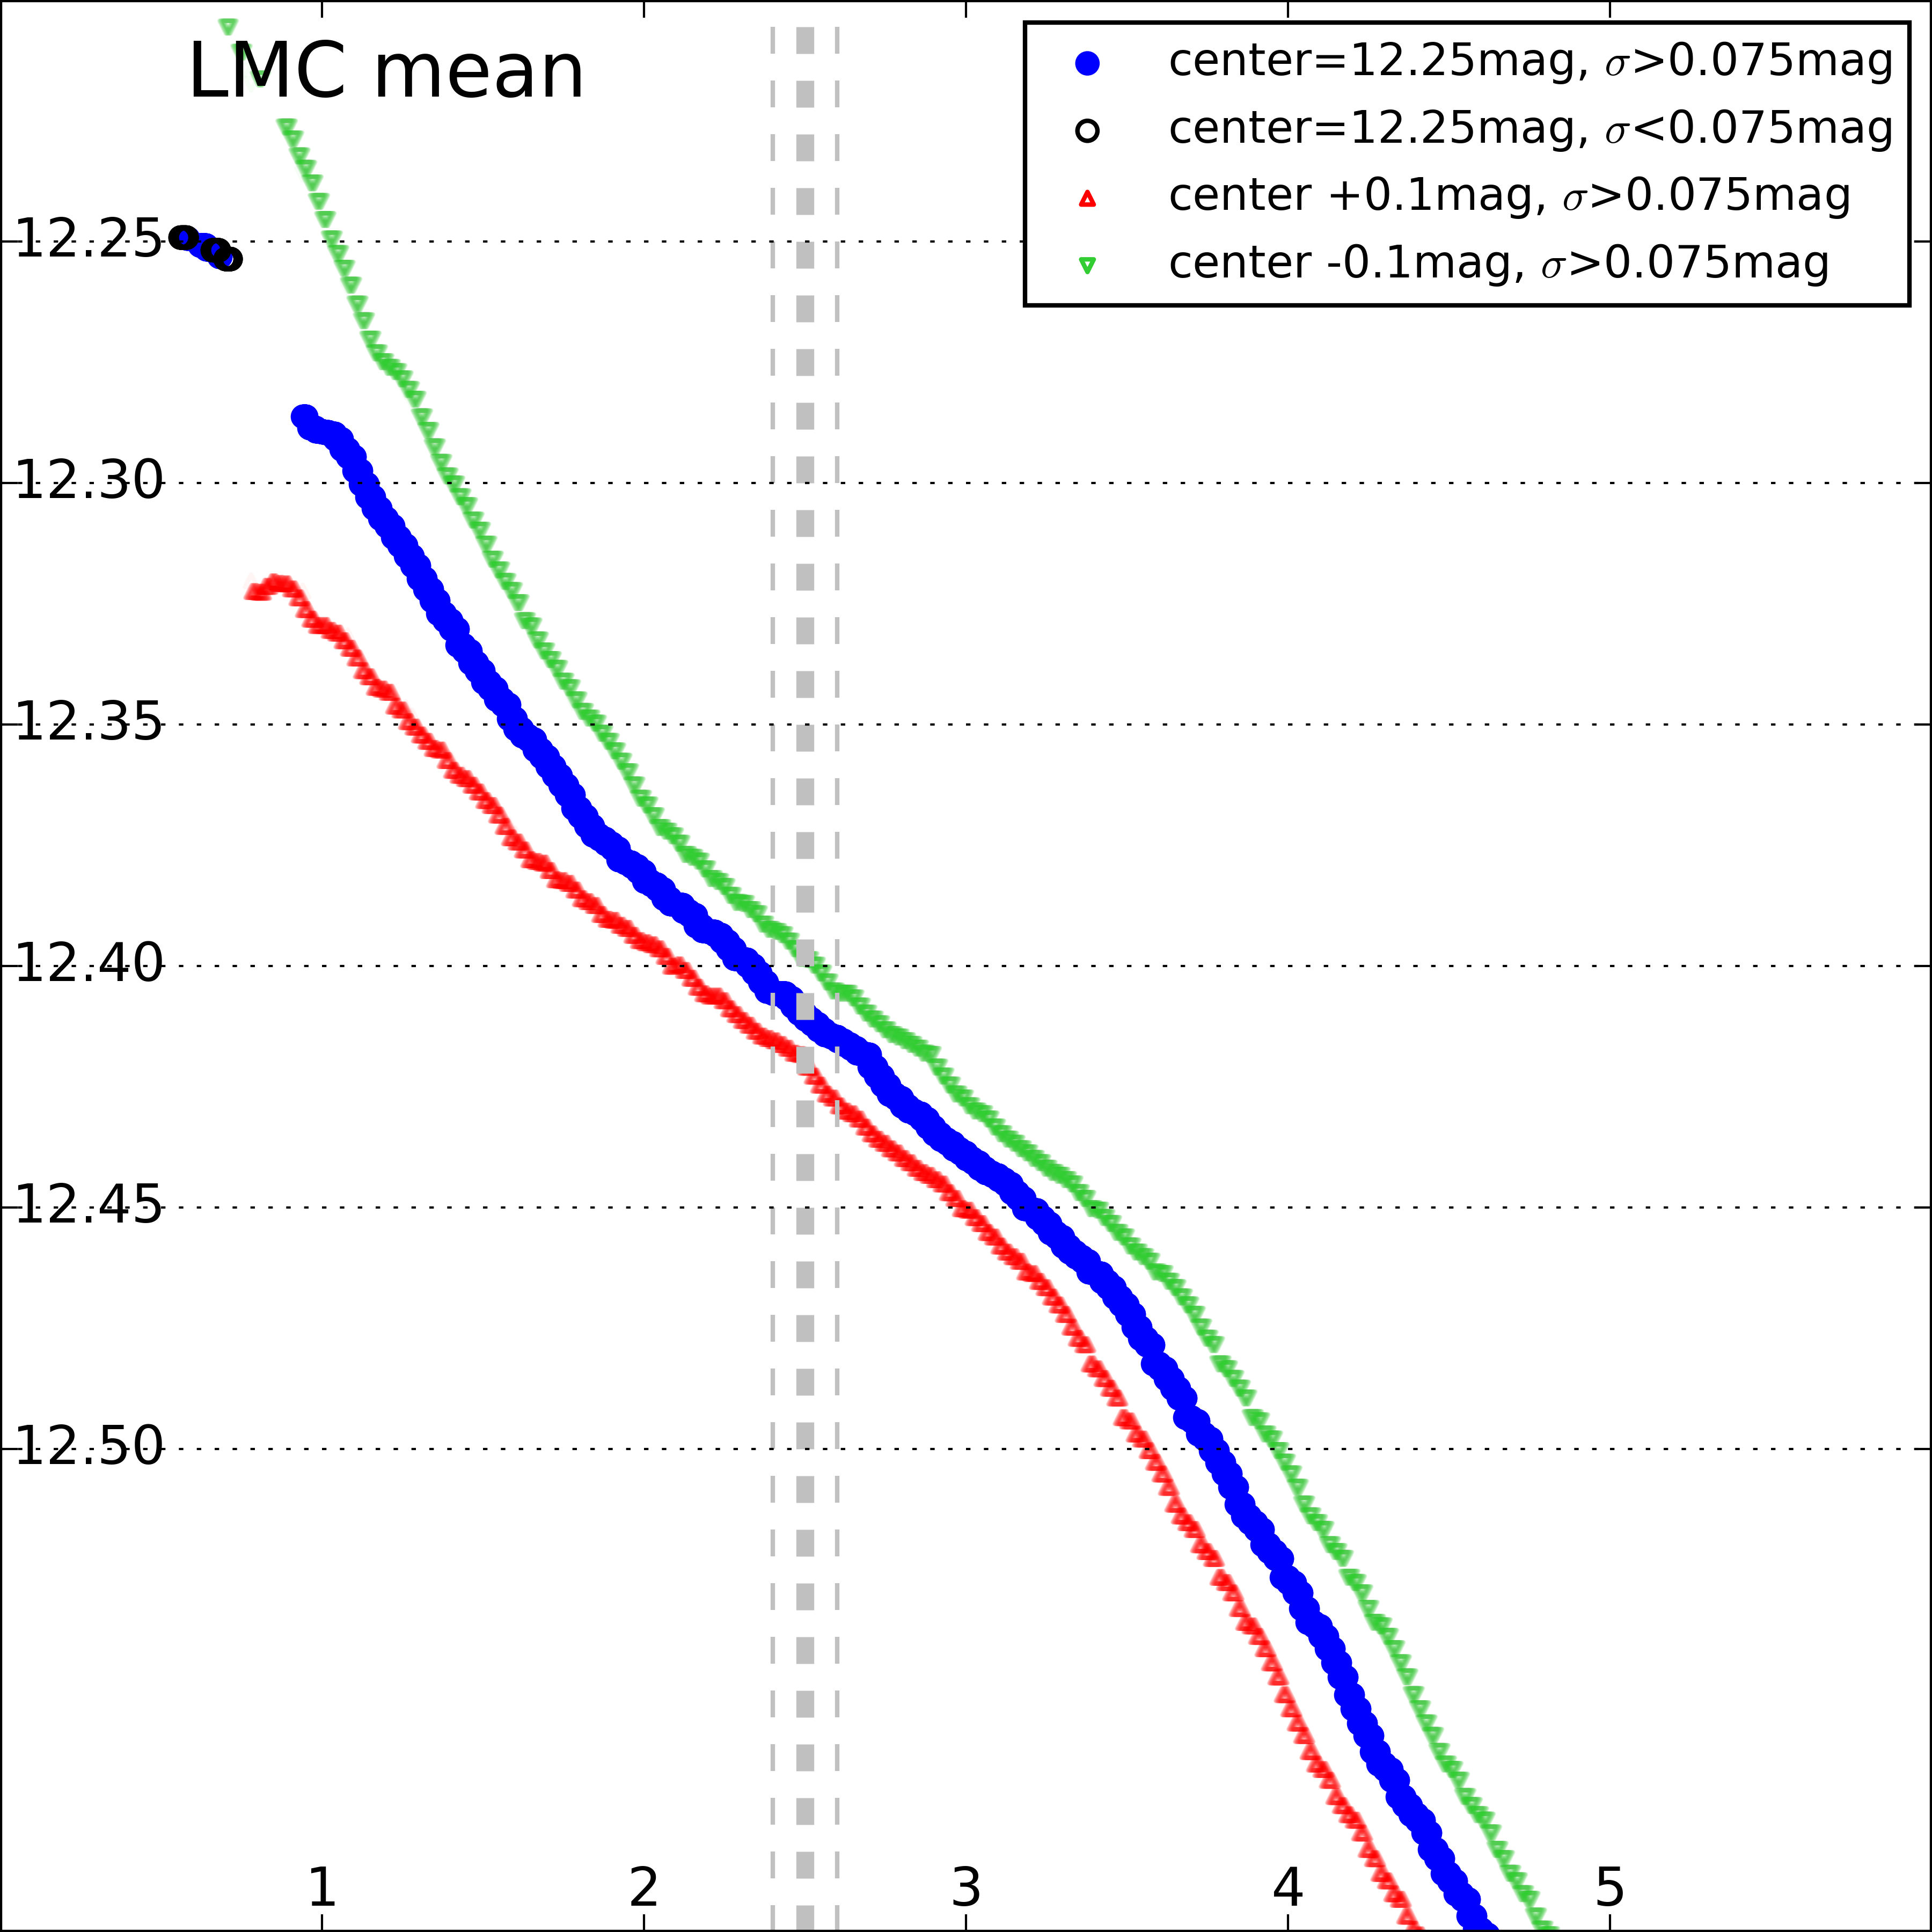
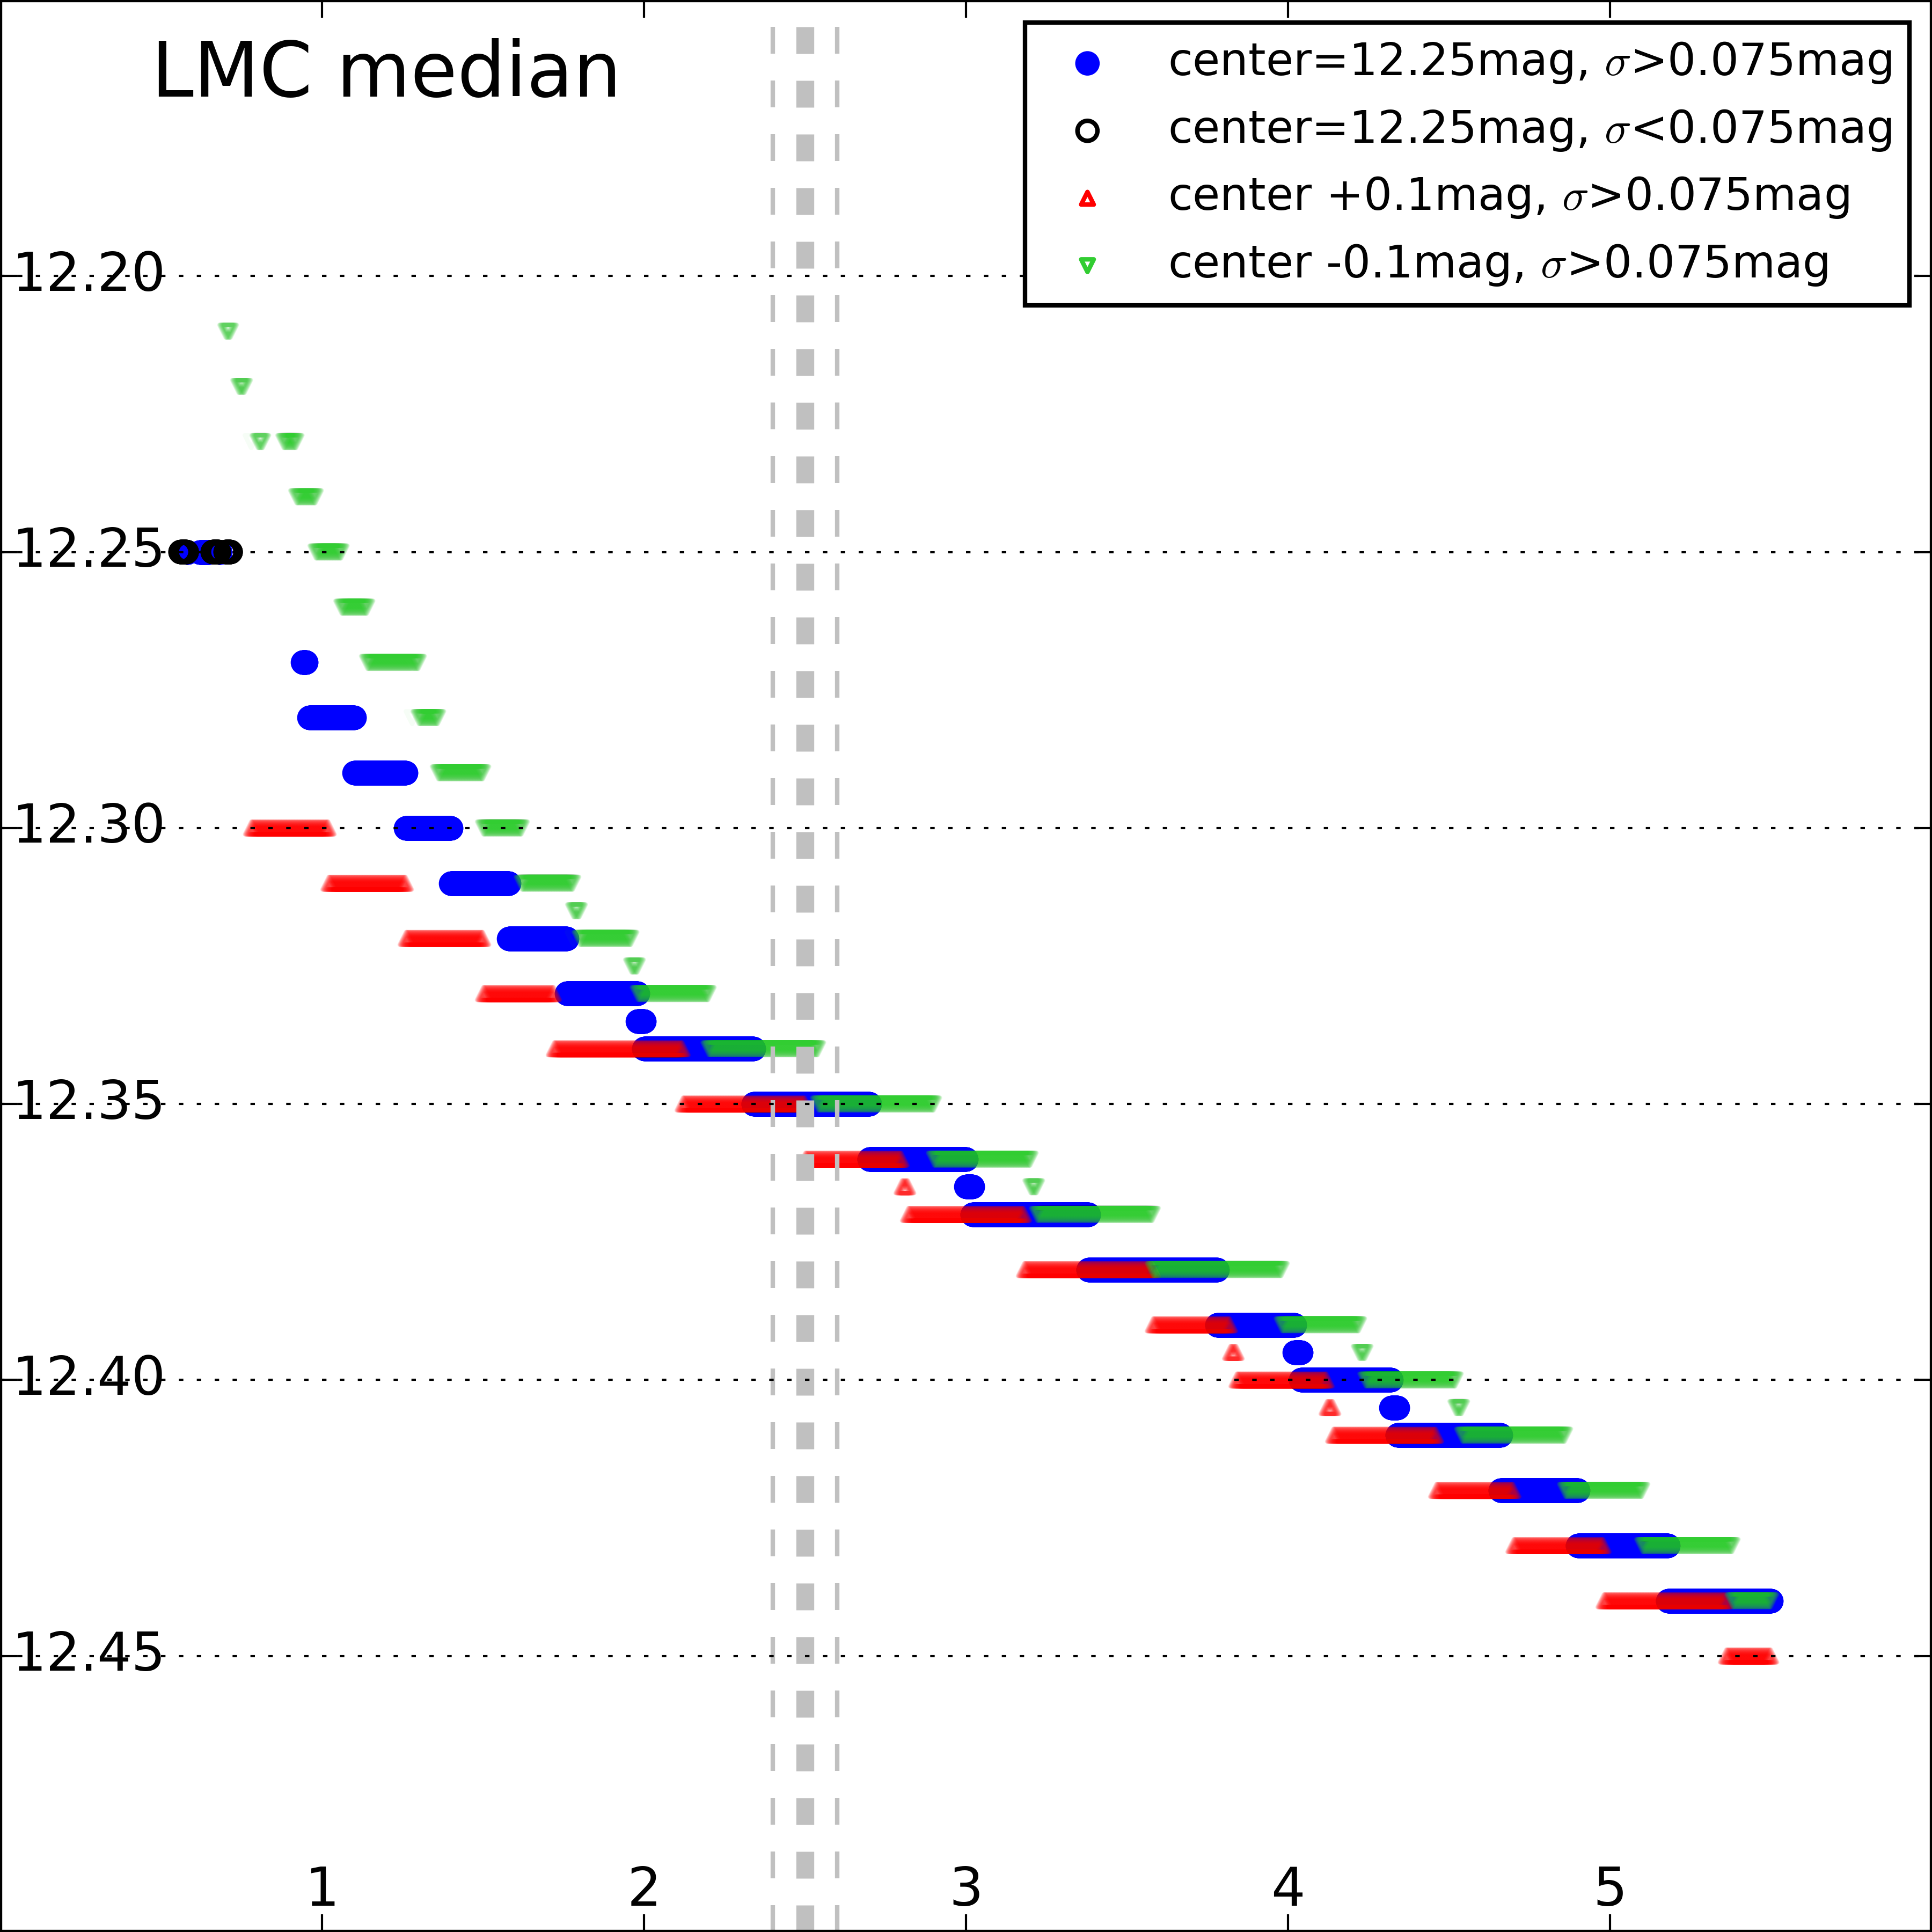
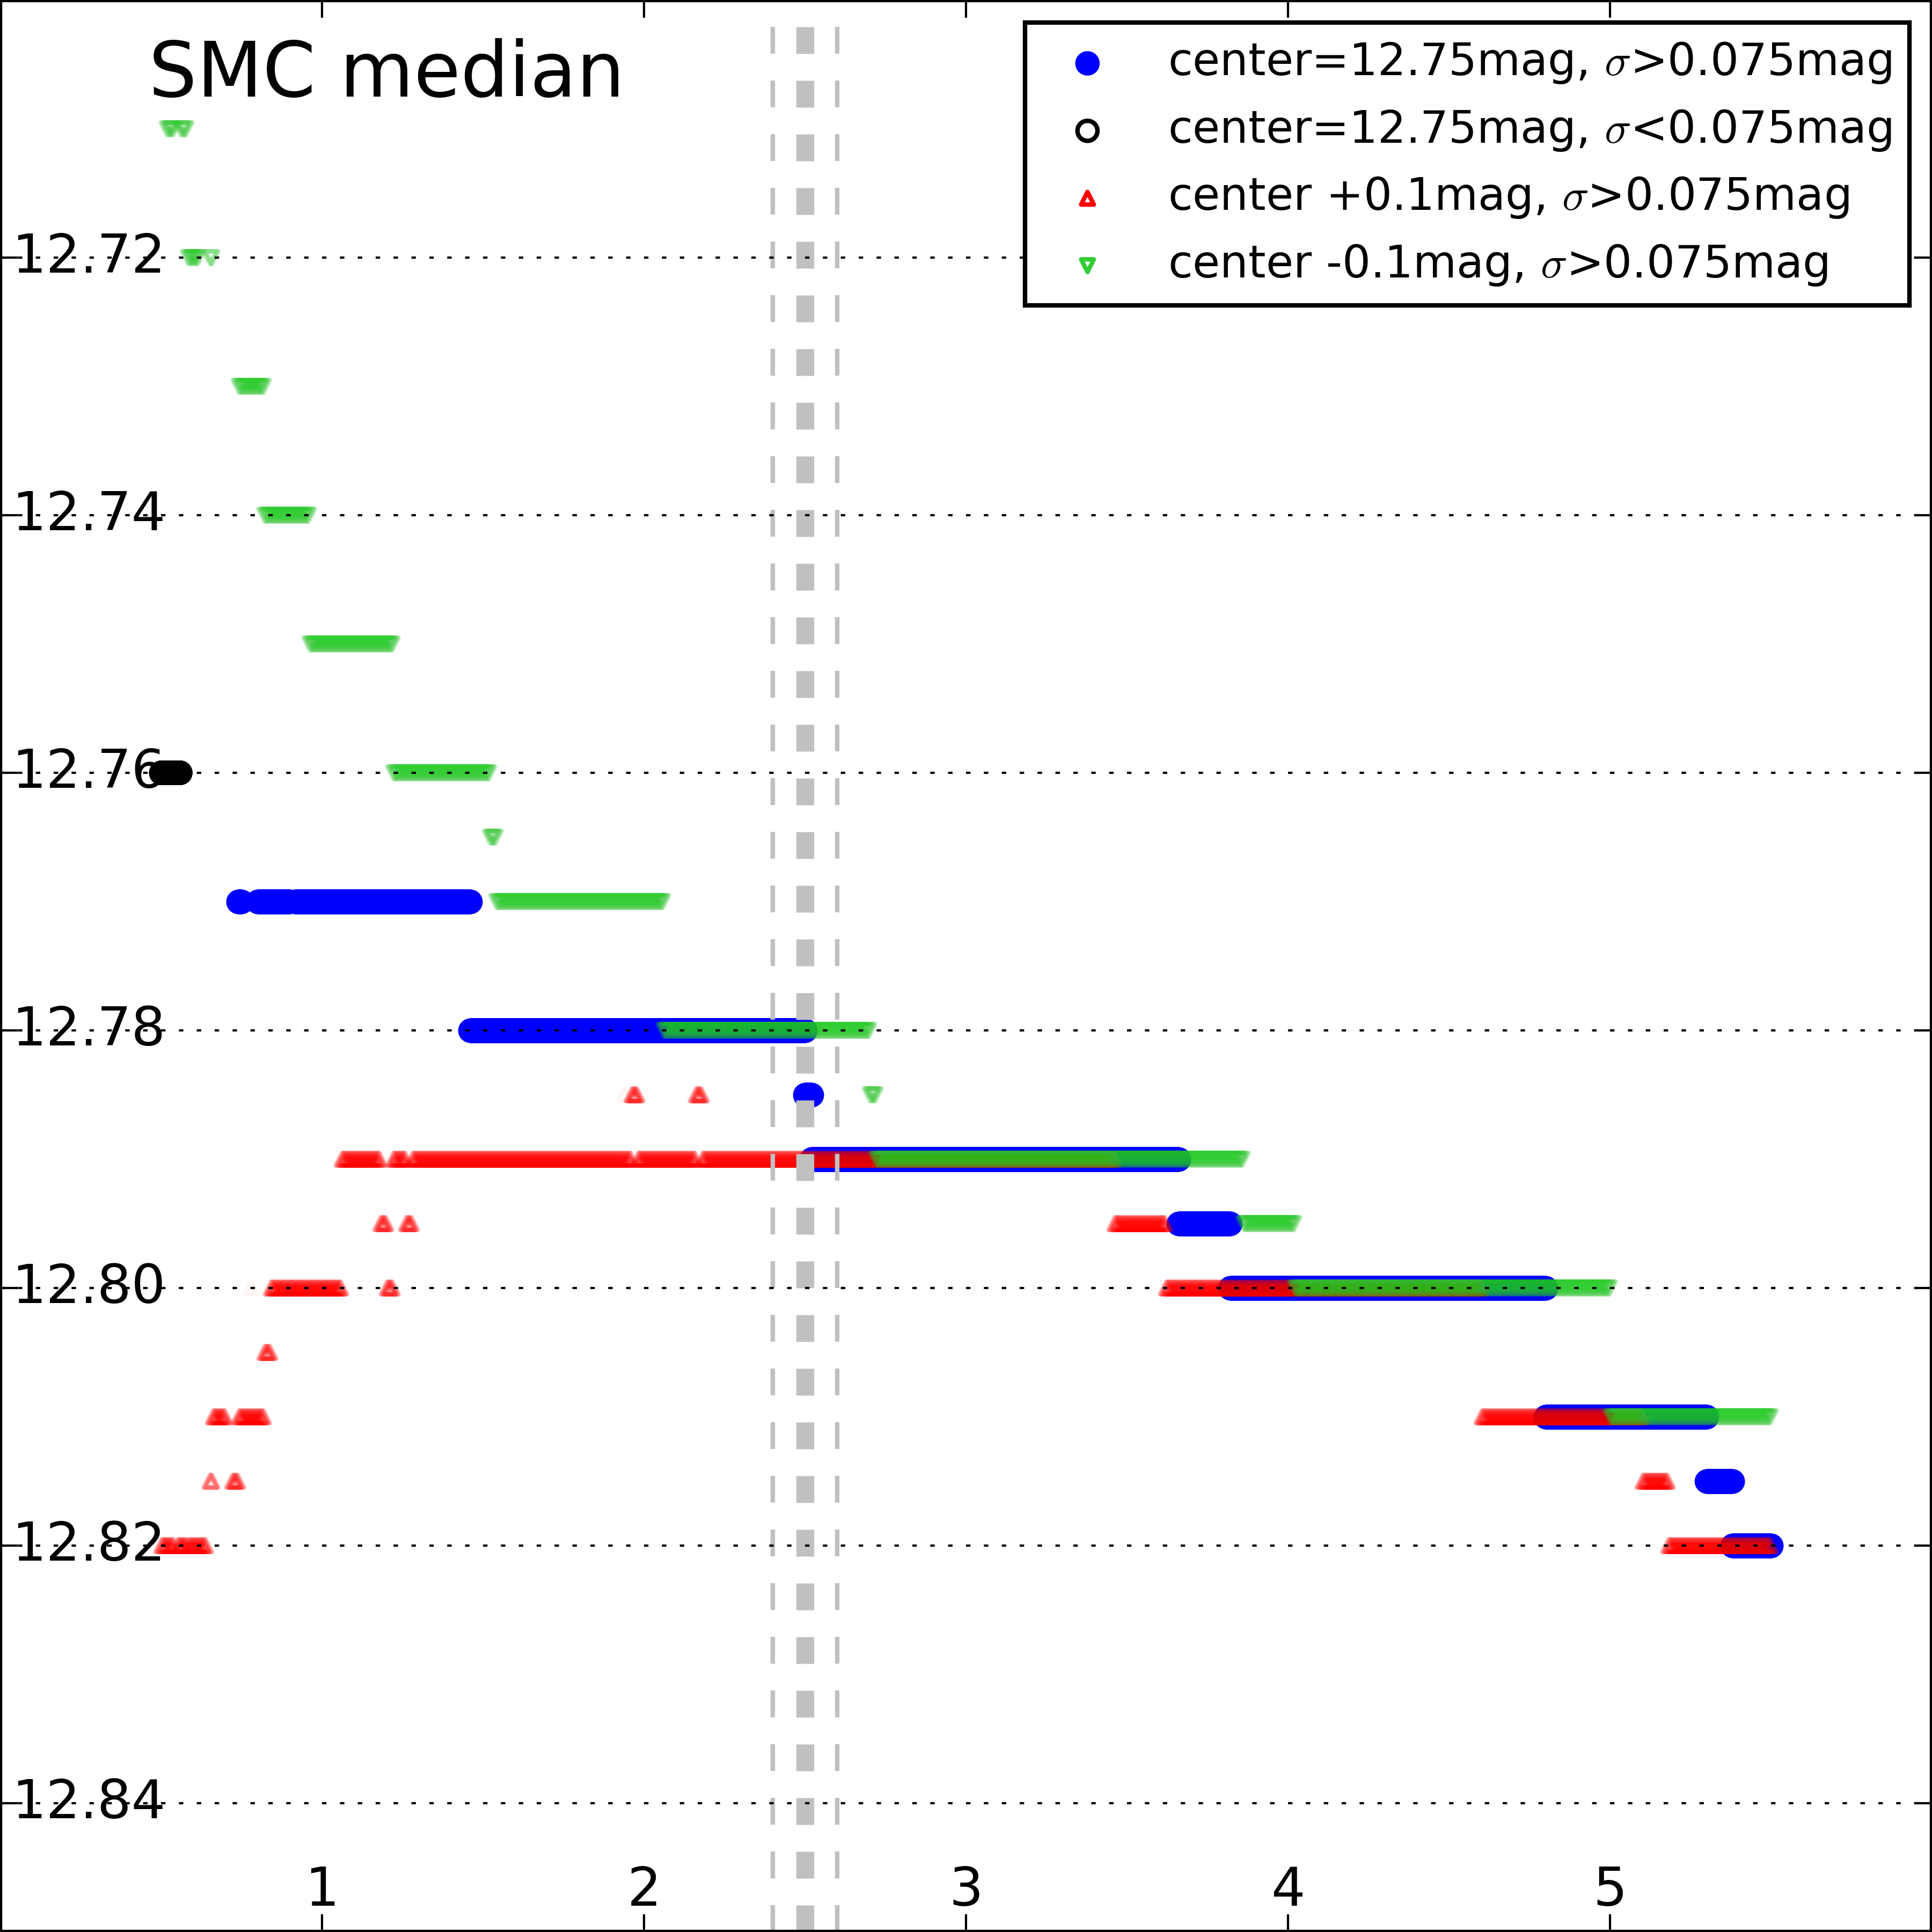
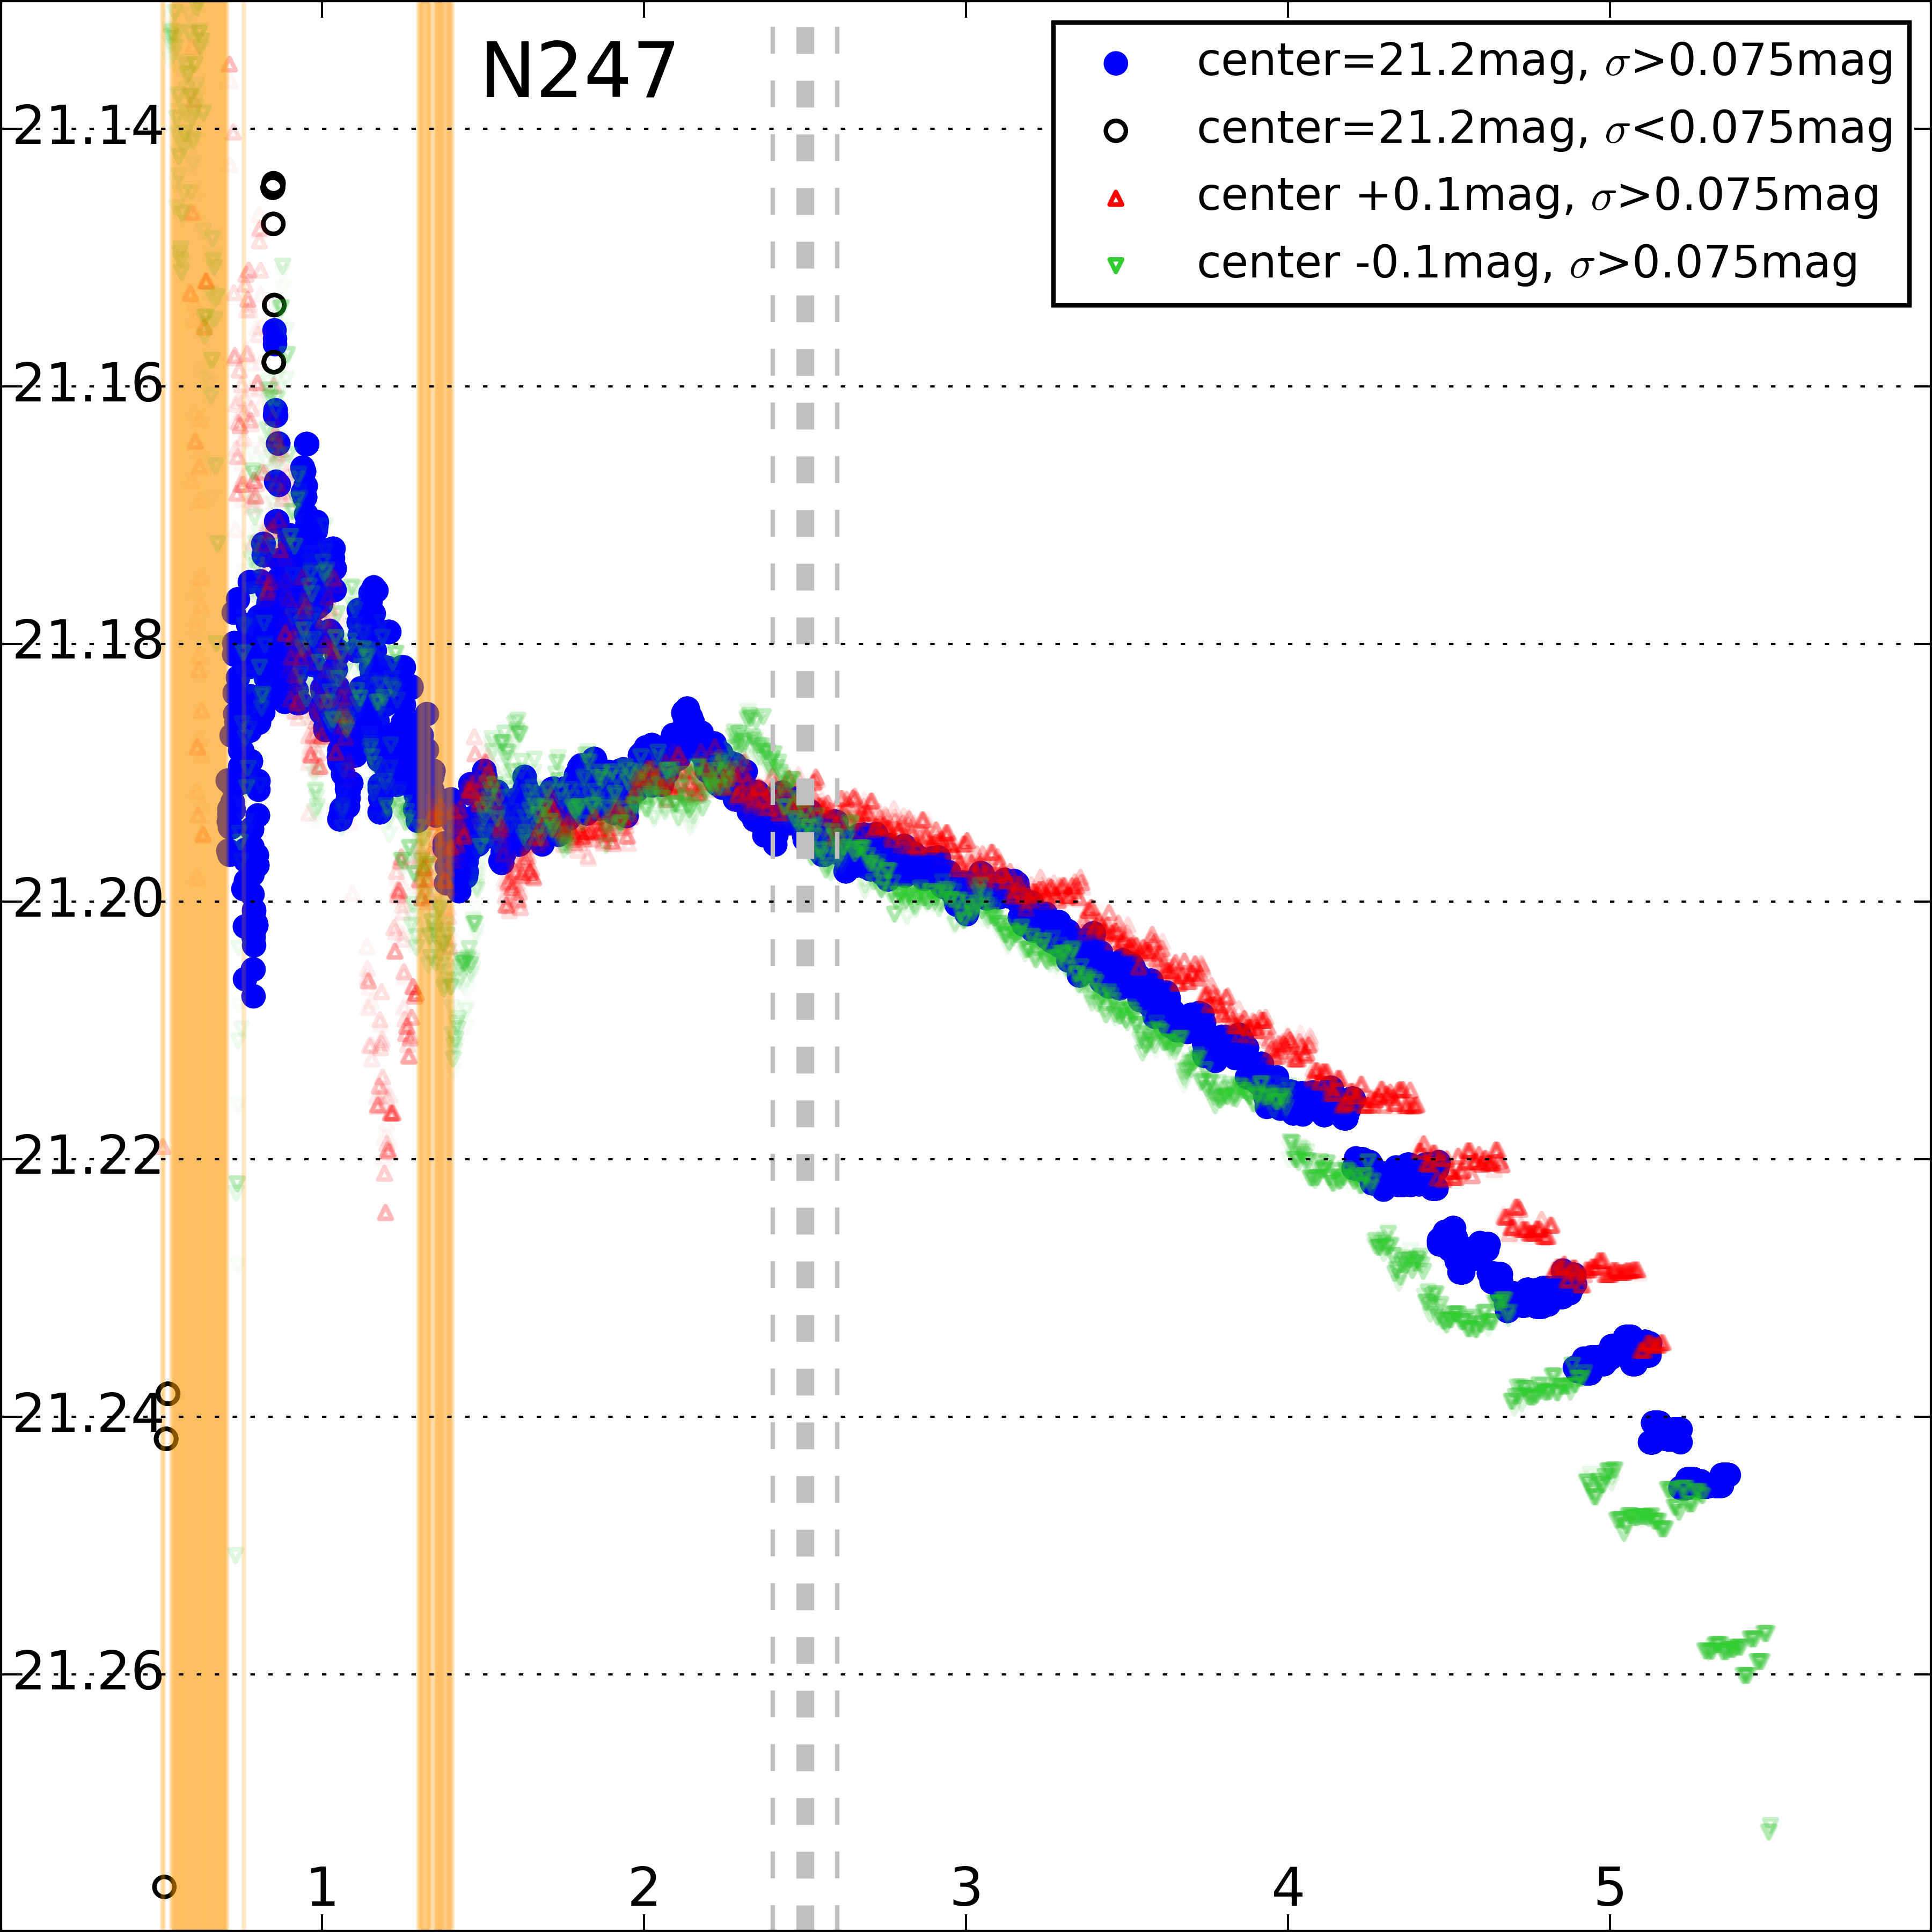
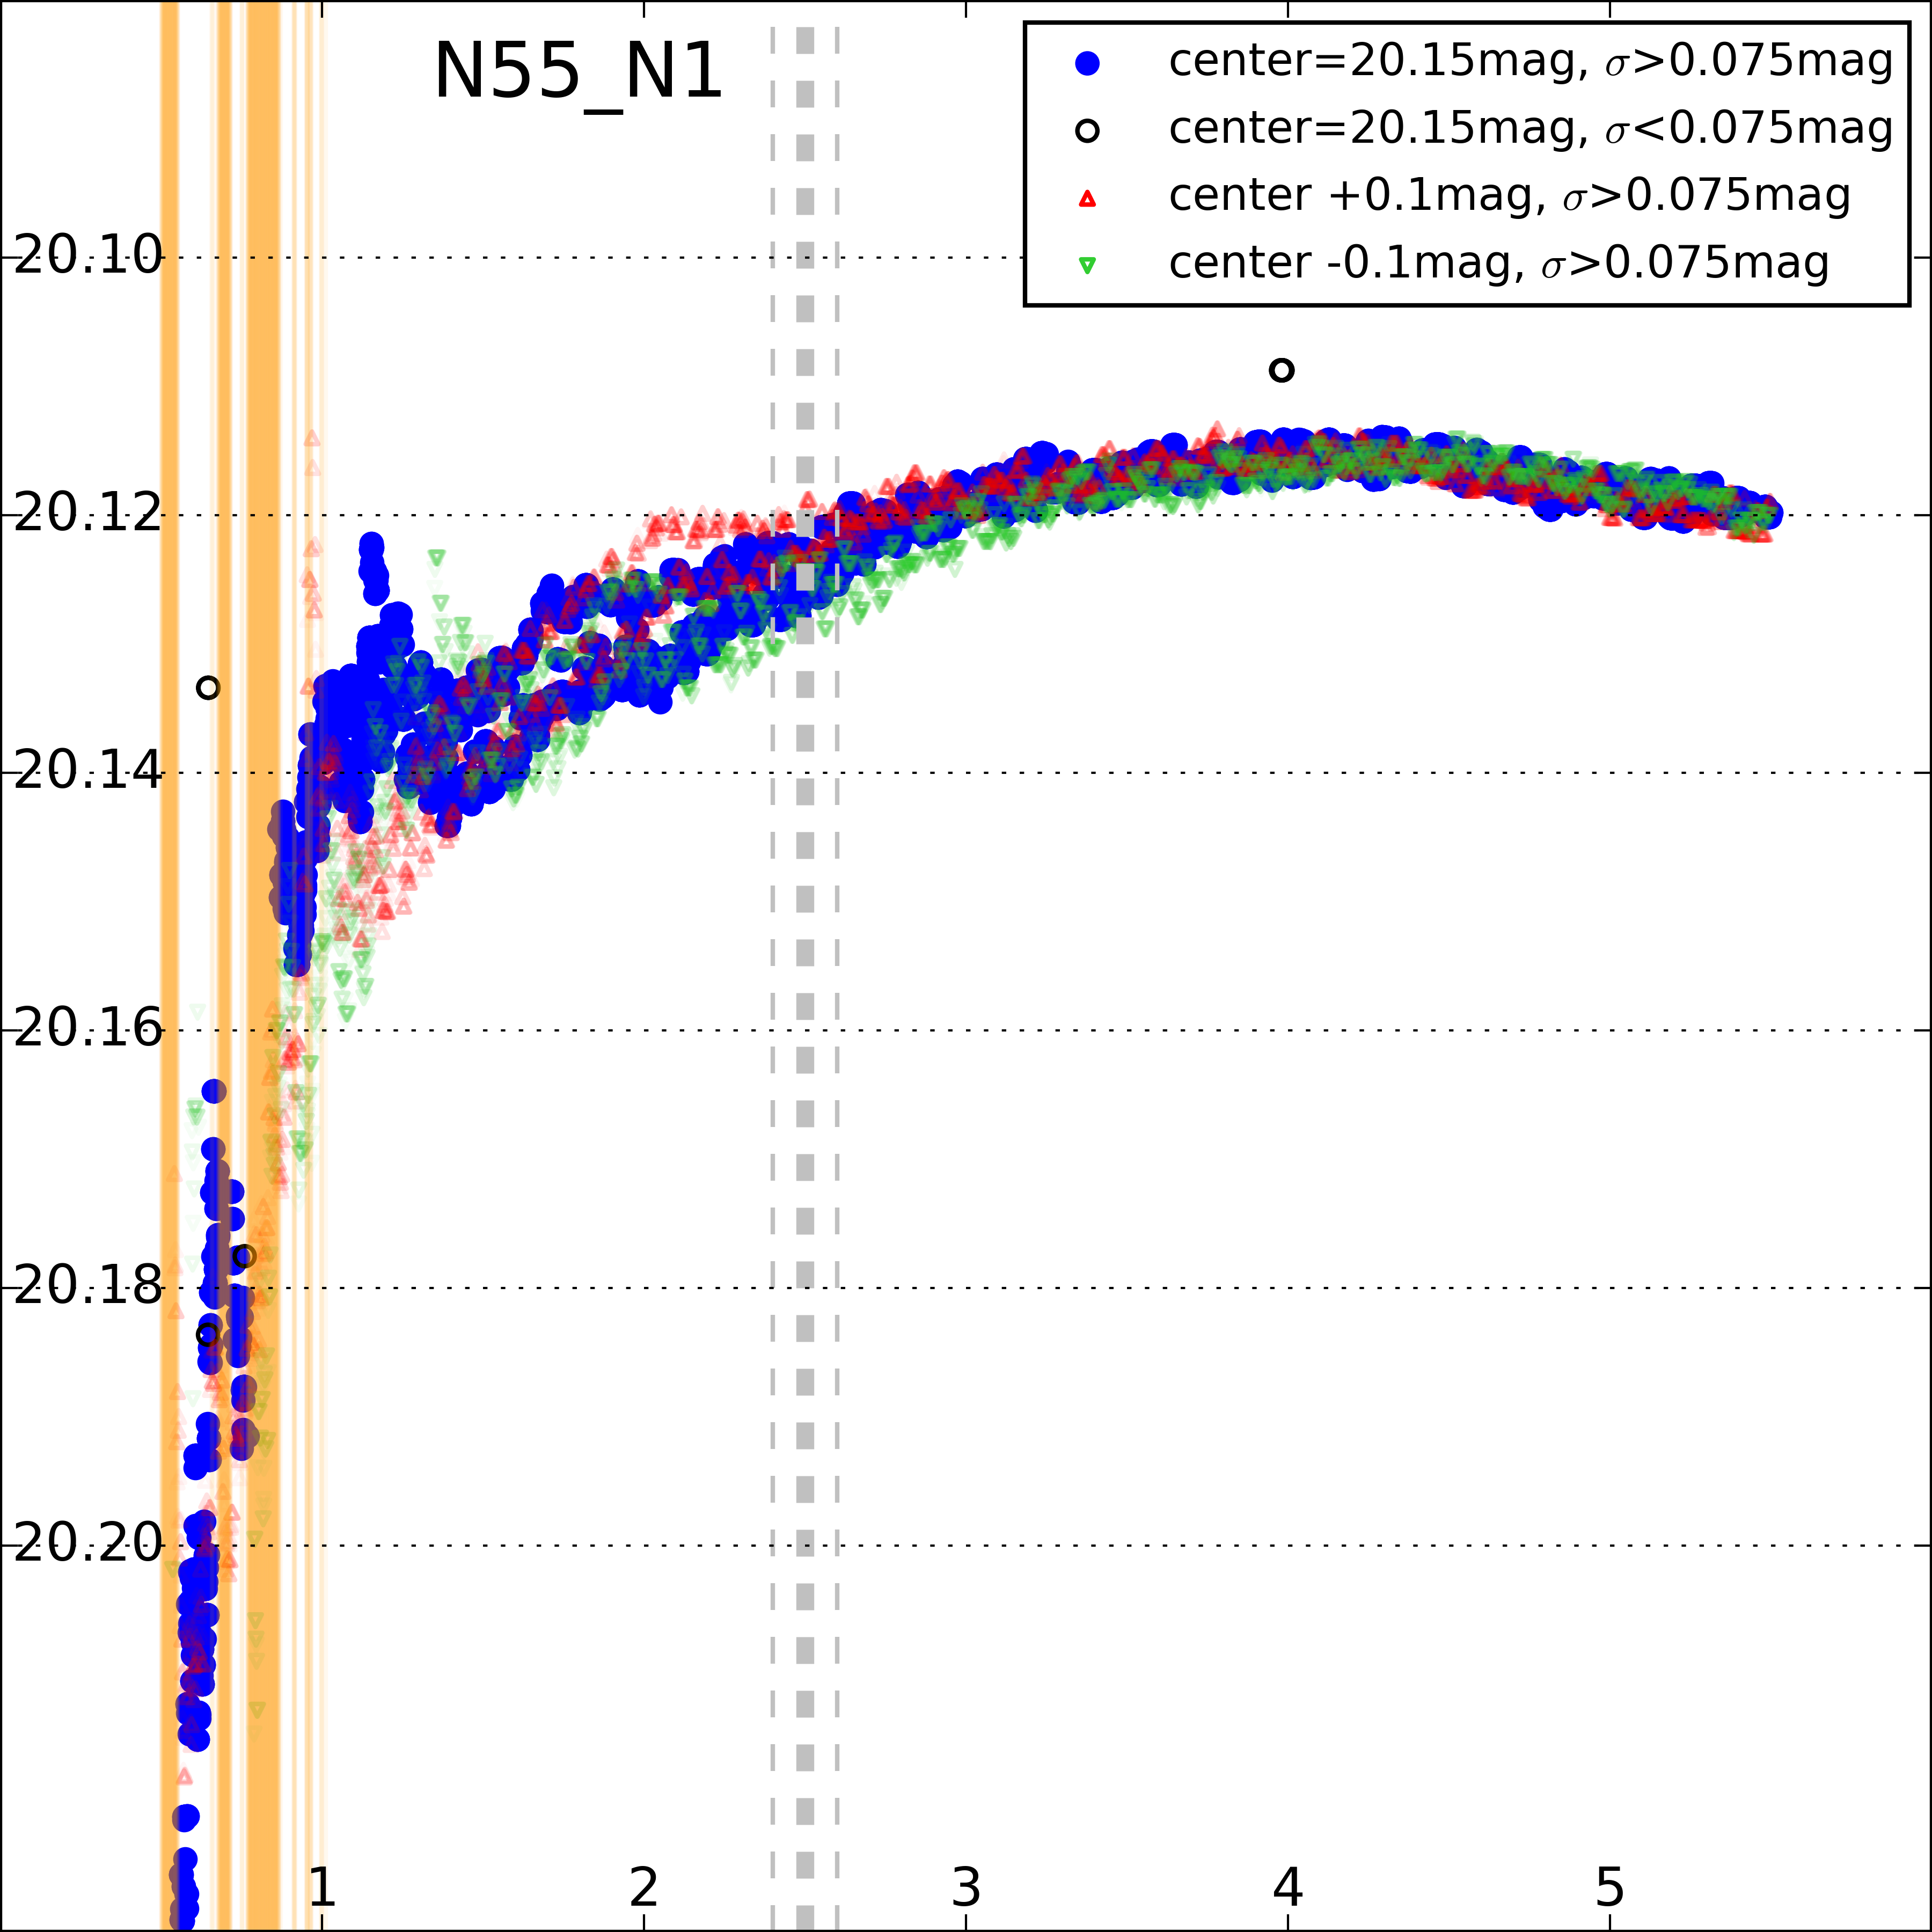
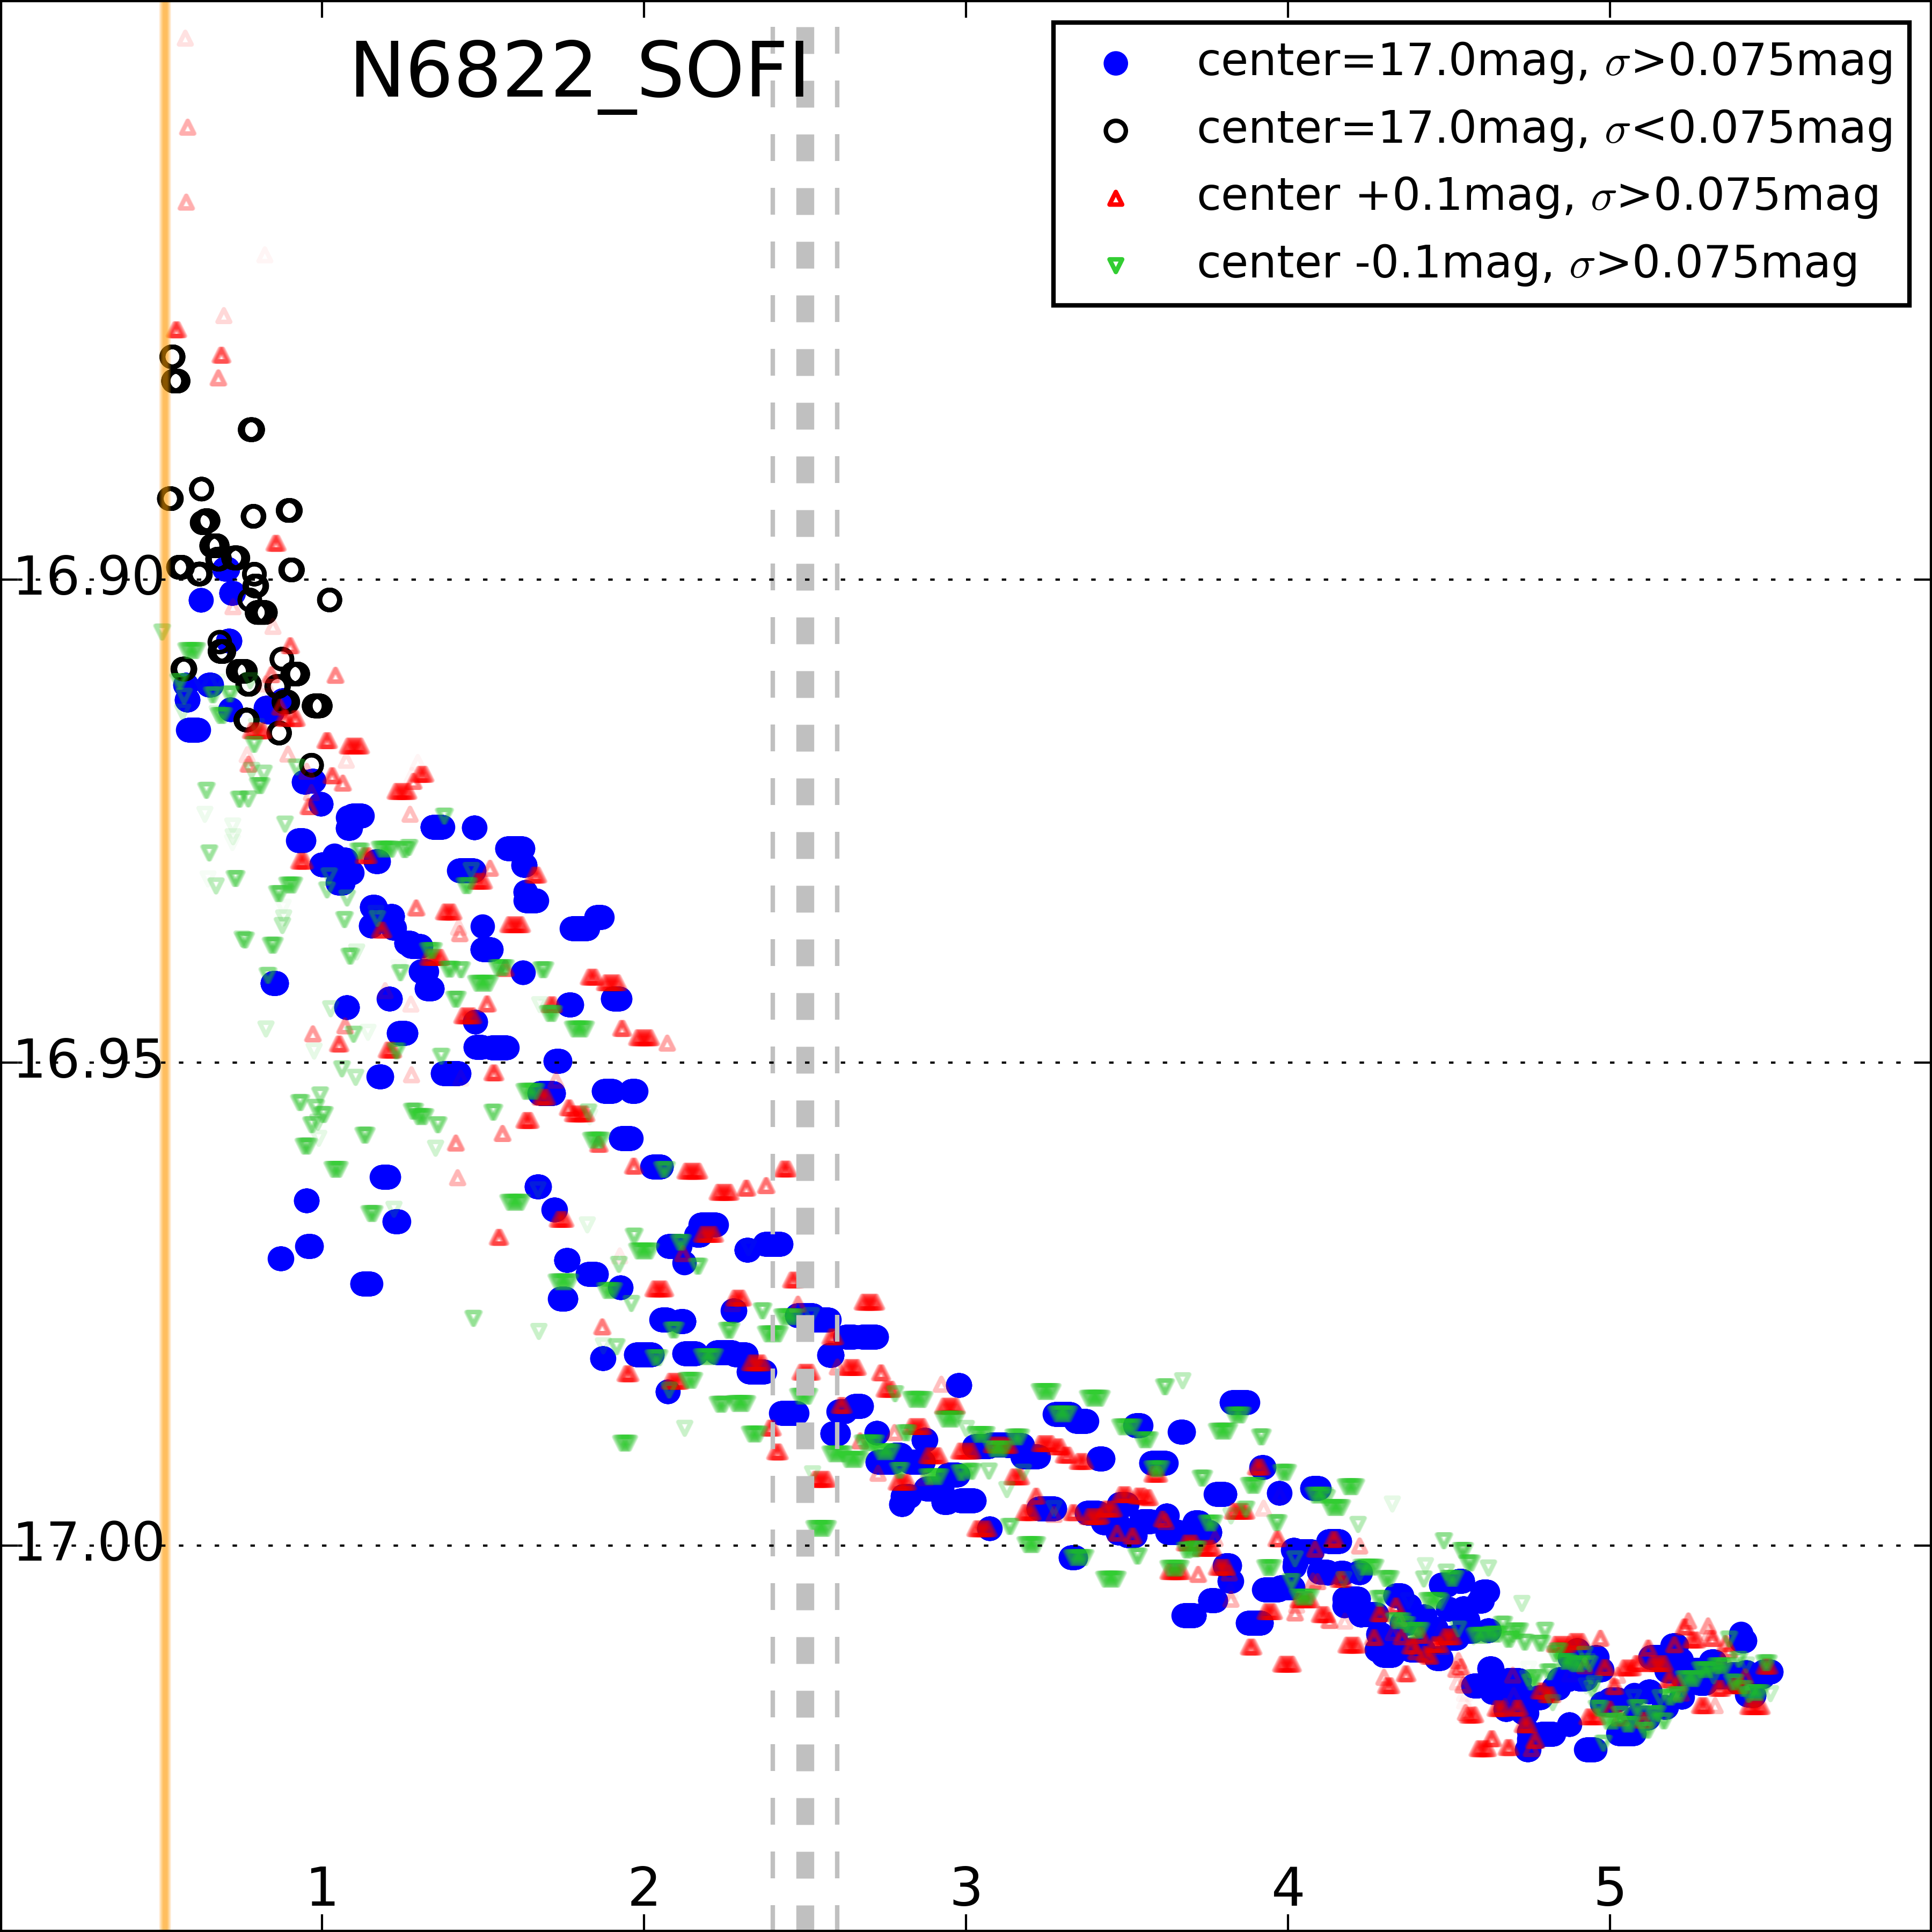
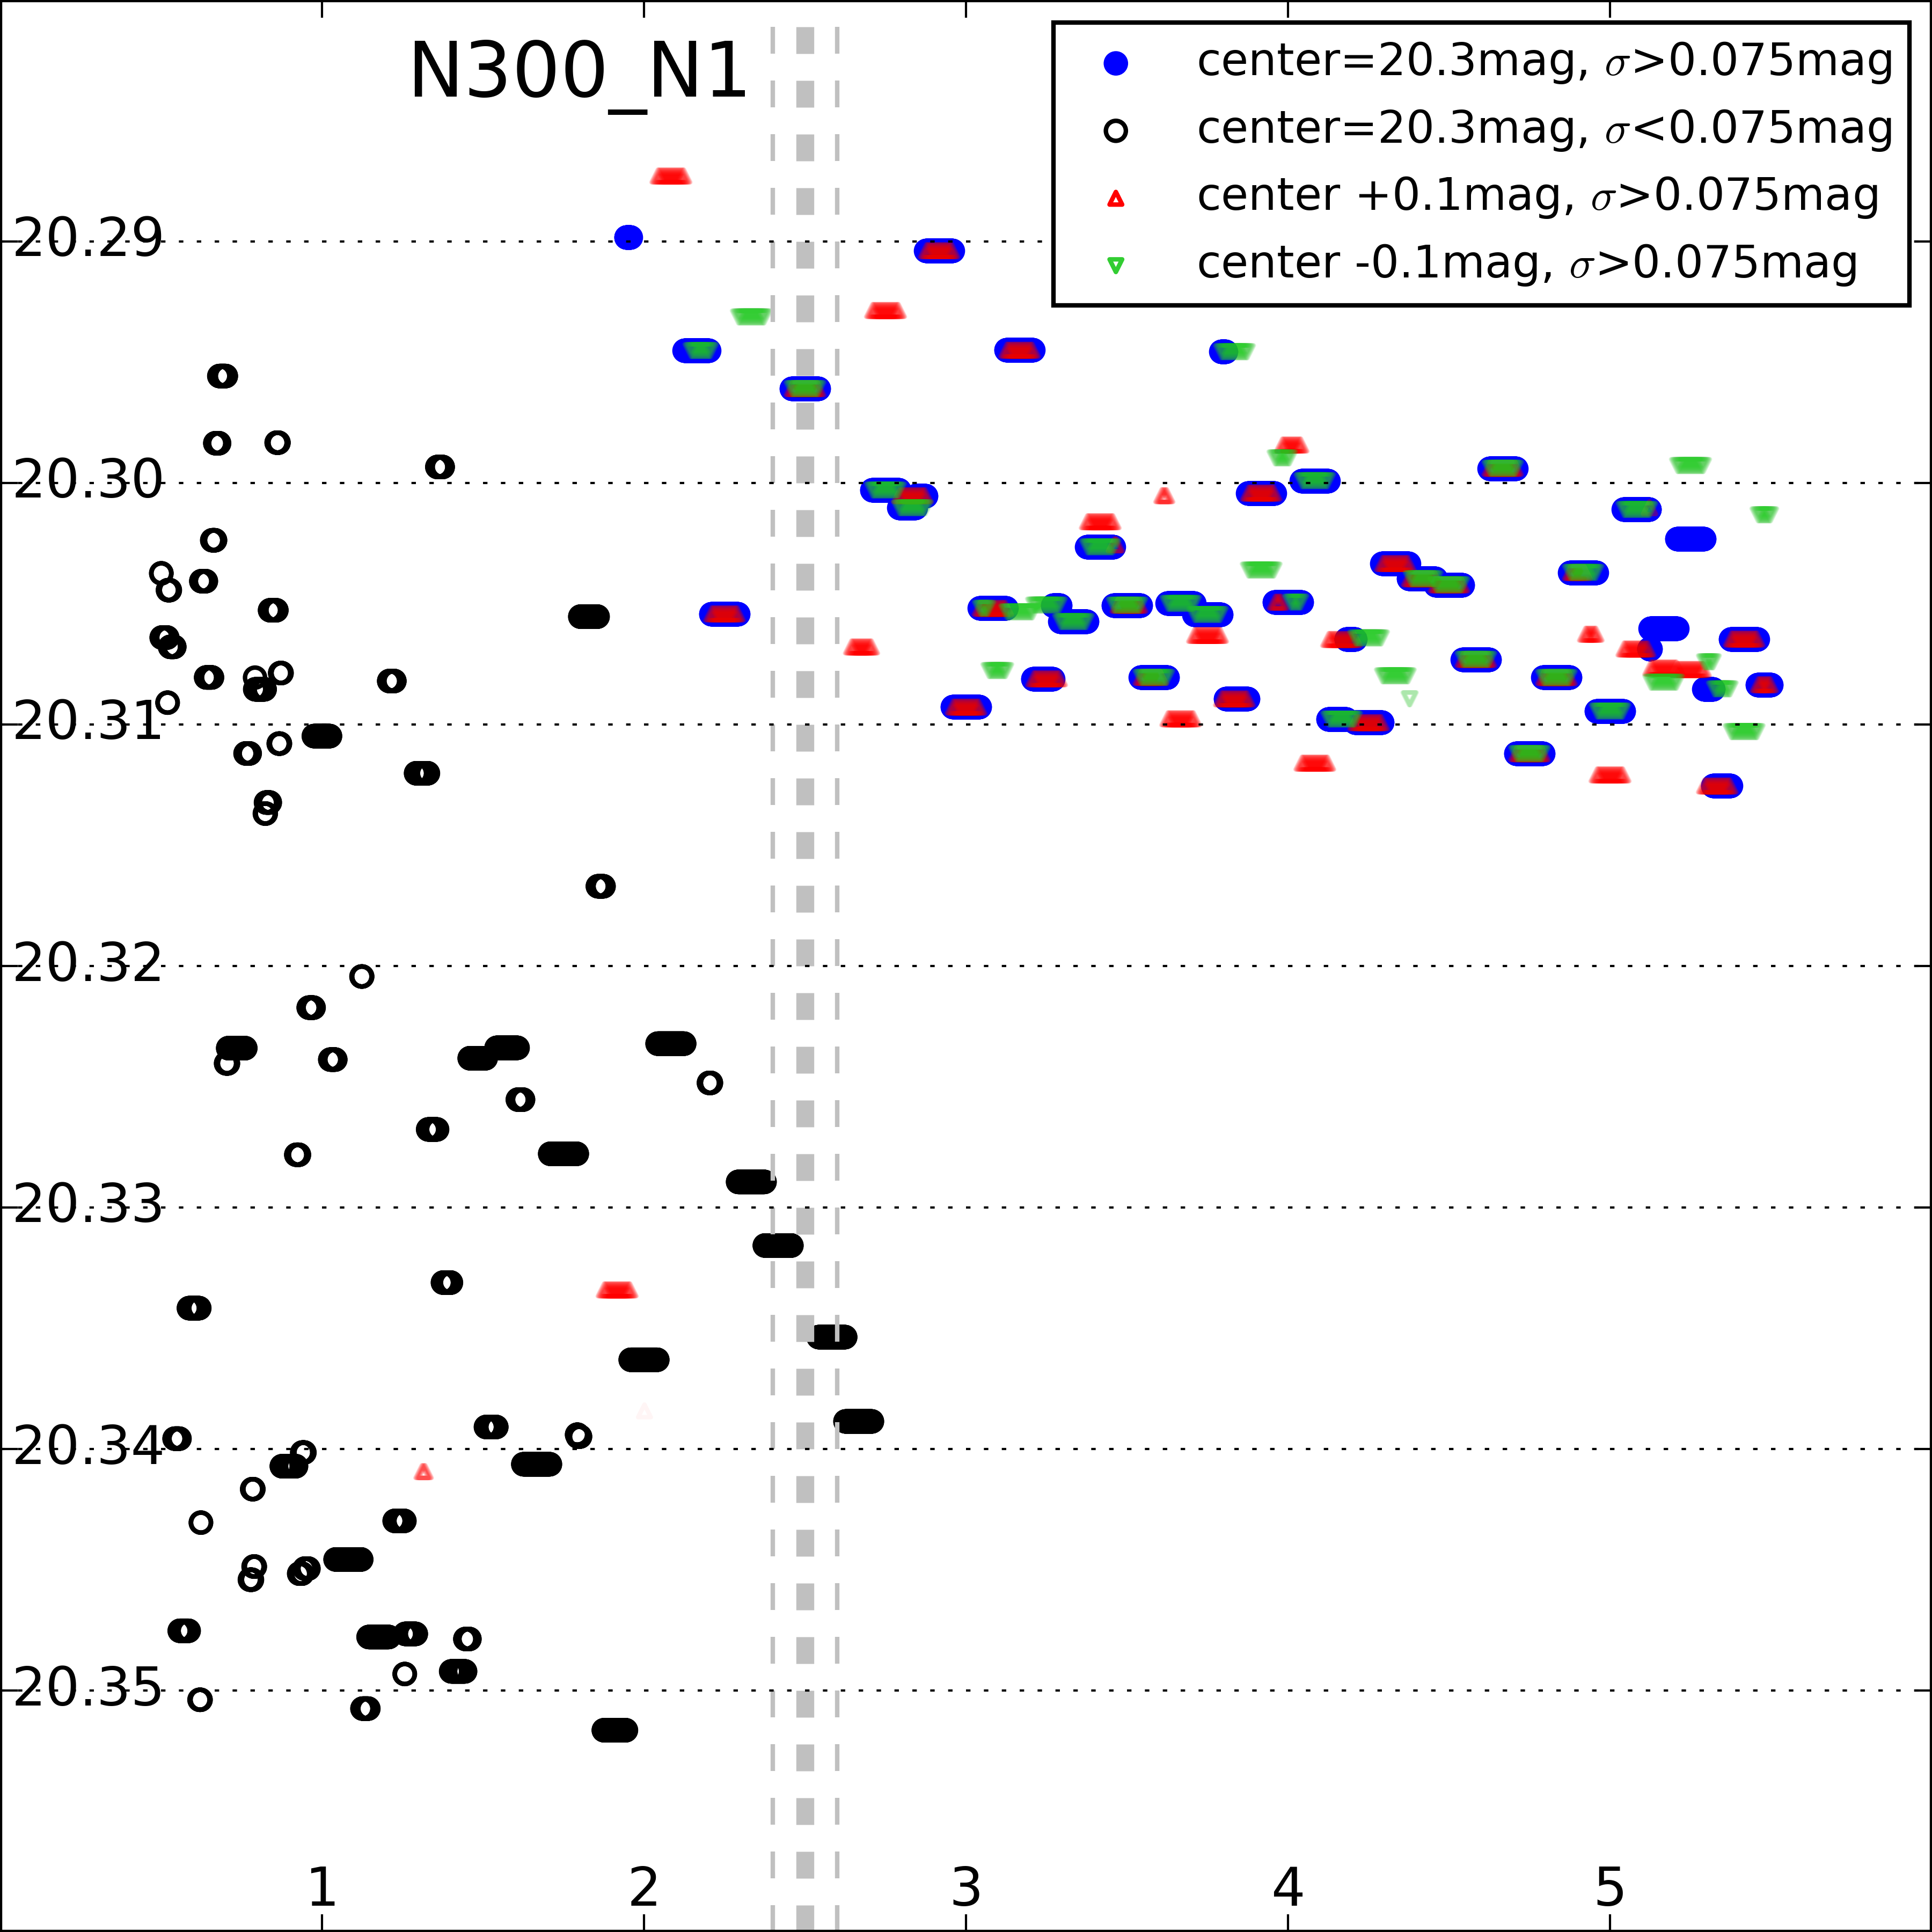
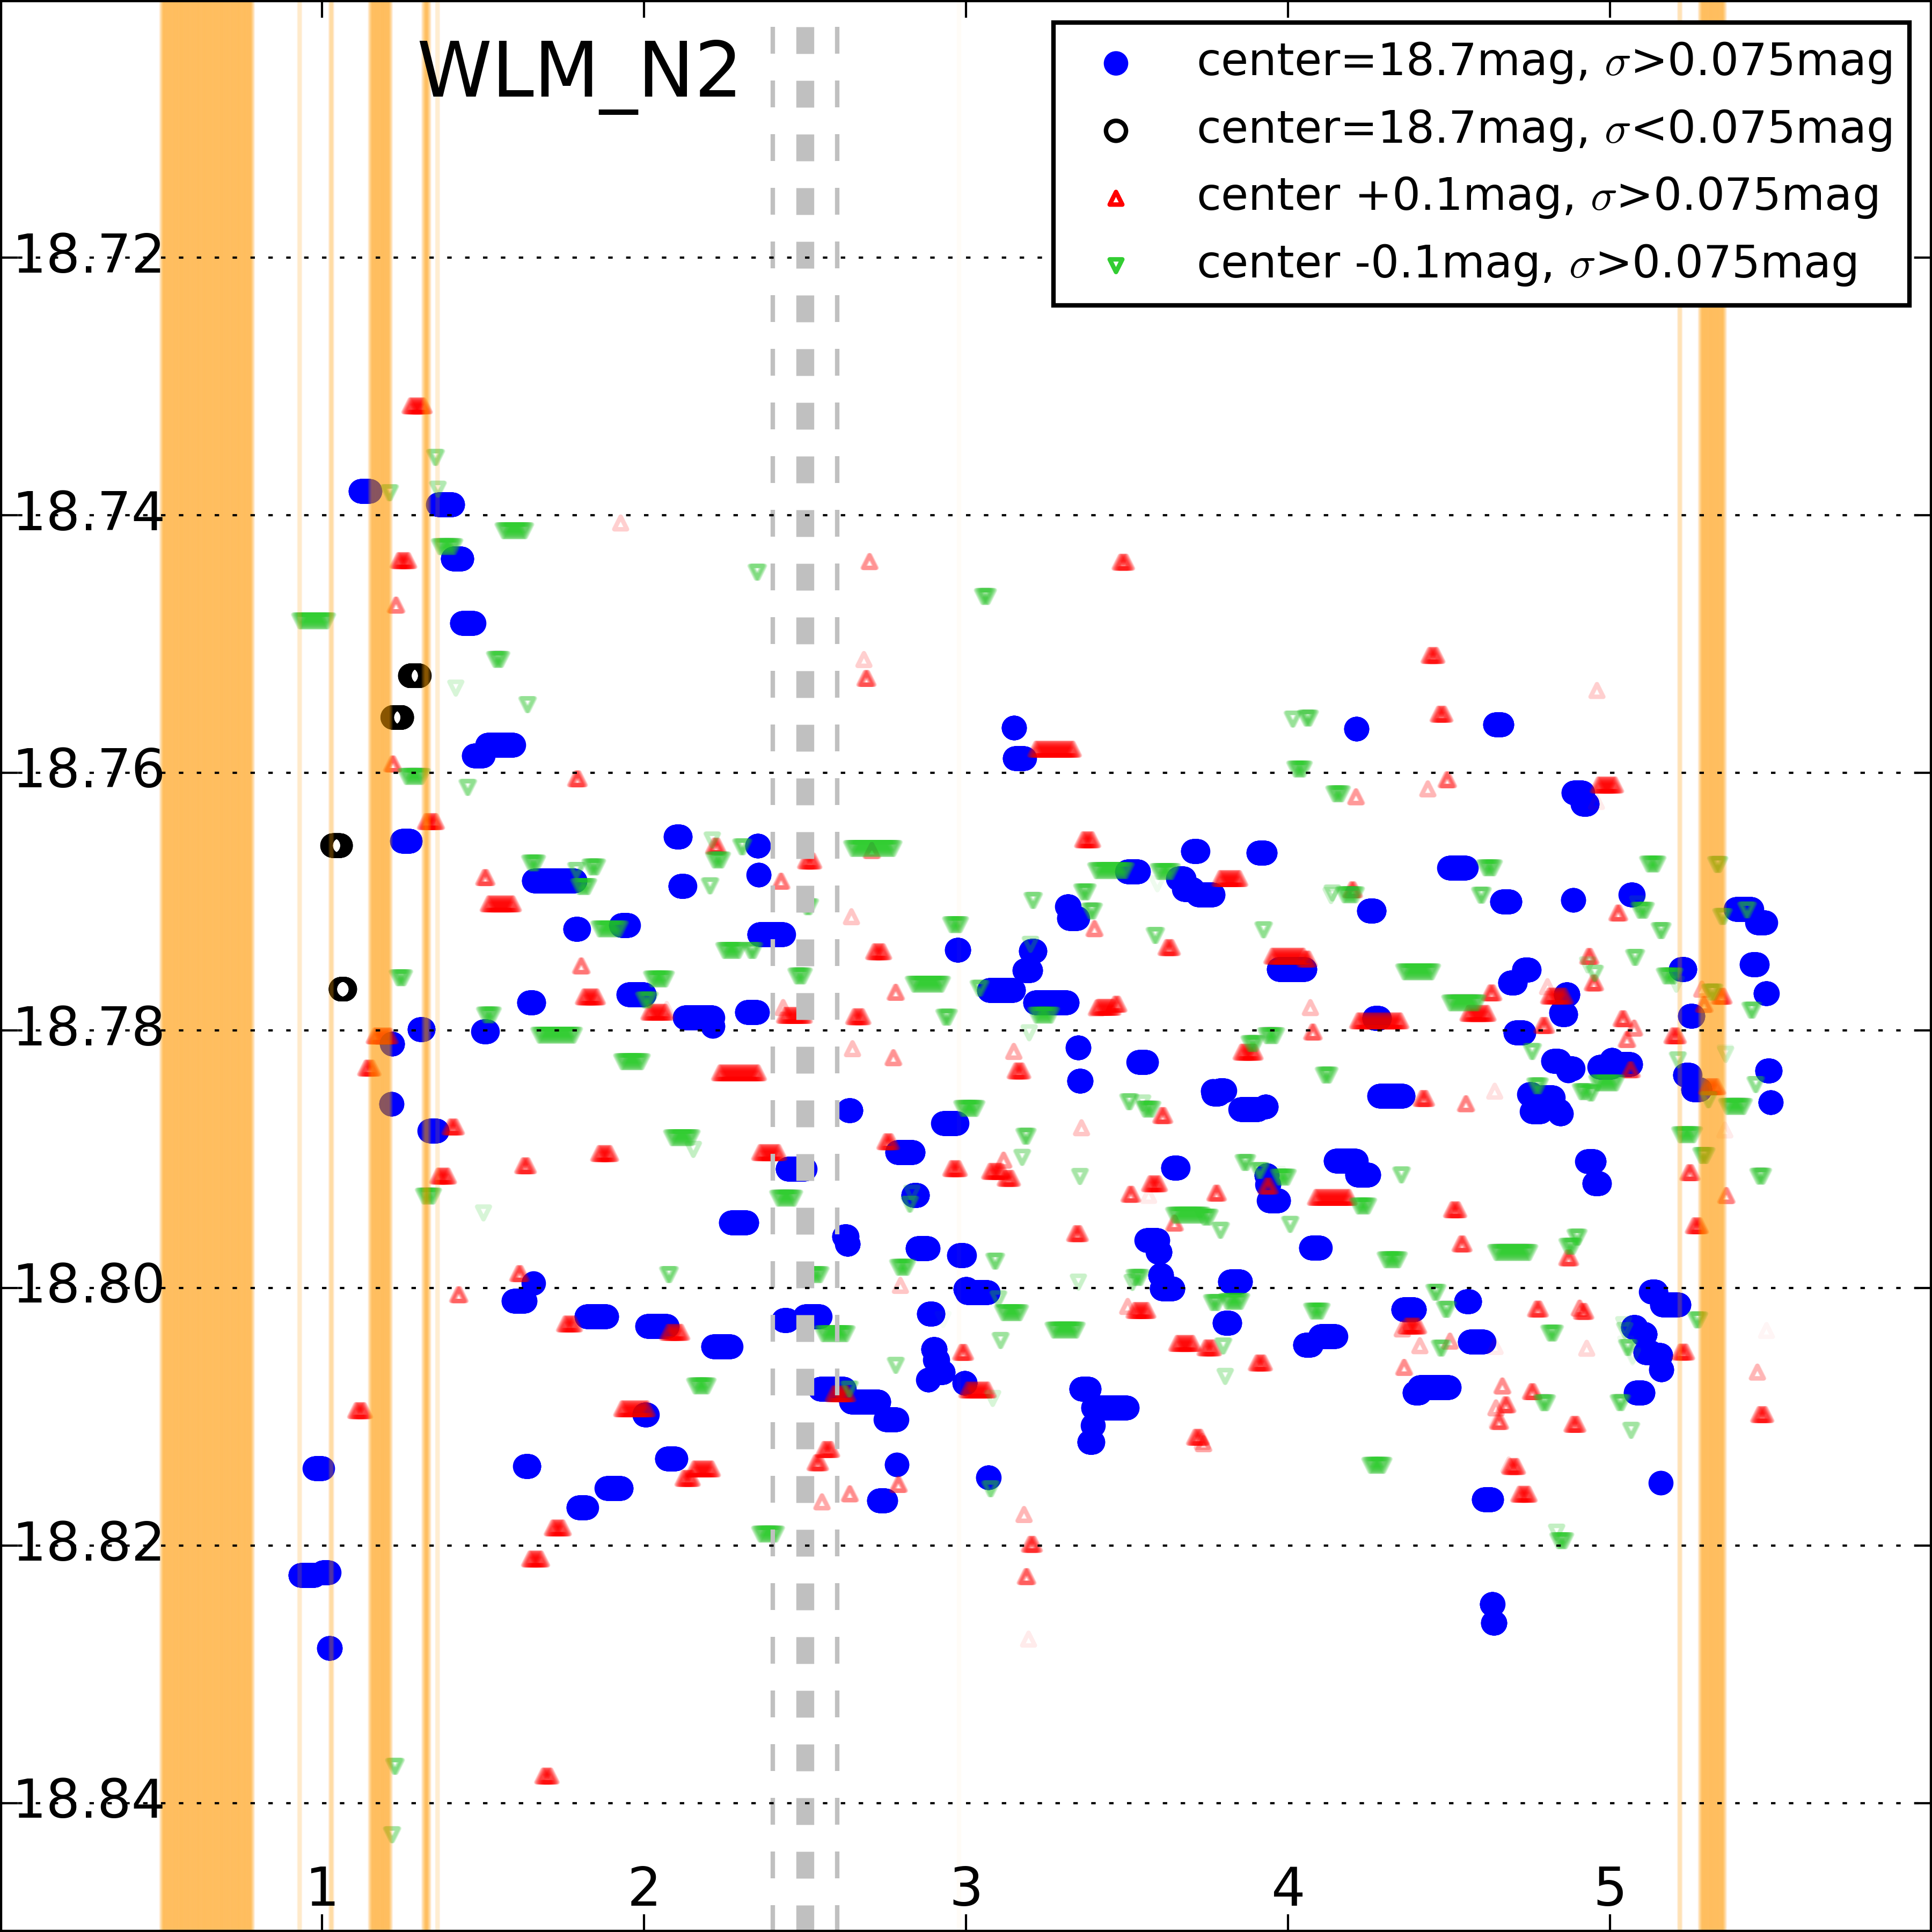
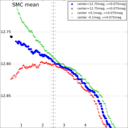
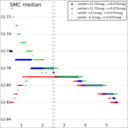
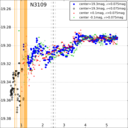
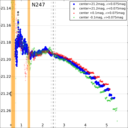
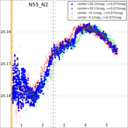
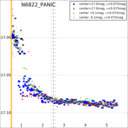
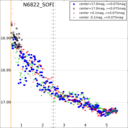
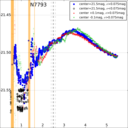
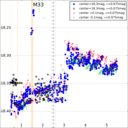
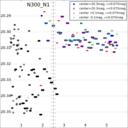
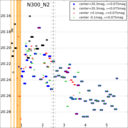
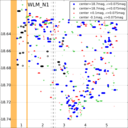
Dependence of obtained results on the selection box size and center
Dependence of the determinations of < J0 > using profile fits (and, additionally, using median and mean in the case of the Magellanic Clouds) on selection-box size (x axis, in mag), and position (three different box centers marked with different shapes. The box size of 2.5 mag chosen for our work (marked by a silver dashed line with a ±0.1 mag interval denoted with thinner lines) gives a stable result (< J0 >, in mag) that does not change significantly with a minor change of the size, and gives universally stable results for the sample of the galaxies we analyzed. Orange areas correspond to selection boxes for which the fit did not converge.
LMC,
profile fit |
LMC,
mean |
LMC,
median |
SMC,
profile fit |
SMC,
mean |
SMC,
median |
N3109 |
N247 |
N55
1st night |
N55
2nd night |
N6822
PANIC |
N6822
SOFI |
N7793 |
M33 |
N300
1st night |
N300
2nd night |
WLM
1st night |
WLM
2nd night |
 |
 |
 |
 |
 |
 |
 |
 |
 |
 |
 |
 |
 |
 |
 |
 |
 |
 |