| Quasars, other active galactic nuclei and many X-ray binaries are powered
by accreting black
holes. The study of those objects offers the best opportunity to apply
and to test general relativity in a strong gravity field.
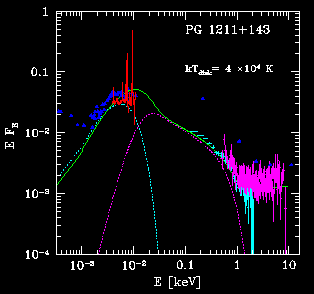
Astronomical sources containing accreting black holes are frequently very bright. Binary stars are up to a milion times brighter than the Sun and quasars are up to thousands times brighter than their host galaxy. Unlike a typical star, an accreting black hole system has a complex structure and emits radiation in a very broad spectral band, from IR through optical/UV to X-ray and gamma-ray. An example of such a spectrum is shown to the right. The shape of the spectrum shows that accreting material is characterized by a very broad temperature range, from 10 000 K to 1 000 000 000 K. The luminosity of the accreting black holes varies significantly, or even dramatically, in seconds, hours, days and years. We study the variations using the optical and X-ray data. |
 |
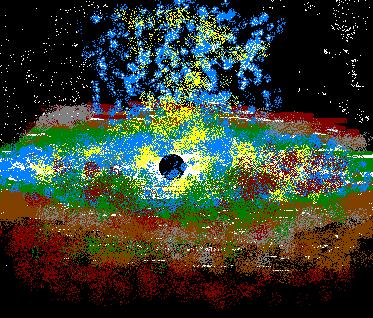
| An idea how the accretion flow and outflow looks like close to the black hole | Broad-band IR/optical/UV/X-ray spectrum of the quasar PG1211+143 (points) and model (lines) |
 |
In our research we try to explain what is the geometry of the flow
which can account for such a broad temperature range, and what is the cause
of the observed variations. We develope a model of a relatively cold disk-like
flow (an accretion disk) which is surrounded by a hot plasma, analogous
to solar corona although
much hotter.
We study the interaction of the hot coronal plasma with the disk through
irradiation and thermal conduction. We consider the posssibility of the
outflow from the corona, inflow of the coronal material towards a black
hole and the exchange of mass between the disk and the corona.
Observations cannot directly confirm this picture since the angular size of this region (a few angular microseconds!) is far below any spatial resolution of available instruments. However, we are currently testing the model through comparison of detailed predictions of the spectra and variability with the observational constraints. |